- Research article
- Open access
- Published:
What does it mean to be good at peer reviewing? A multidimensional scaling and cluster analysis study of behavioral indicators of peer feedback literacy
International Journal of Educational Technology in Higher Education volume 21, Article number: 26 (2024)
Abstract
Peer feedback literacy is becoming increasingly important in higher education as peer feedback has substantially grown as a pedagogical approach. However, quality of produced feedback, a key behavioral aspect of peer feedback literacy, lacks a systematic and evidence-based conceptualization to guide research, instruction, and system design. We introduce a novel framework involving six conceptual dimensions of peer feedback quality that can be measured and supported in online peer feedback contexts: reviewing process, rating accuracy, feedback amount, perceived comment quality, actual comment quality, and feedback content. We then test the underlying dimensionality of student competencies through correlational analysis, Multidimensional Scaling, and cluster analysis, using data from 844 students engaged in online peer feedback in a university-level course. The separability of the conceptual dimensions is largely supported in the cluster analysis. However, the cluster analysis also suggests restructuring perceived and actual comment quality in terms of initial impact and ultimate impact. The Multi-Dimensional Scaling suggests the dimensions of peer feedback can be conceptualized in terms of relative emphasis on expertise vs. effort and on overall review quality vs. individual comment quality. The findings provide a new road map for meta-analyses, empirical studies, and system design work focused on peer feedback literacy.
Introduction
Peer review, as a student-centered pedagogical approach, has become widely used in higher education (Gao et al., 2023; Kerman et al., 2024). In recent years, higher education research has begun to investigate peer feedback literacy (Dawson et al., 2023; Little et al., 2024; Nieminen & Carless, 2023). Peer feedback literacy refers to the capacity to comprehend, interpret, provide, and effectively utilize feedback in a peer review context (Dong et al., 2023; Man et al., 2022; Sutton, 2012). It supports learning processes by fostering critical thinking, enhancing interpersonal skills, and promoting active engagement in course groupwork (Hattie & Timperley, 2007). To date, conceptualizations of peer feedback literacy have primarily been informed by interview and survey data (e.g., Dong et al., 2023; Woitt et al., 2023; Zhan, 2022). These methods have provided valuable insights into learners’ knowledge of and attitudes towards peer feedback. However, they have not generally examined the behavioral aspect of peer feedback literacy, especially the quality of the feedback that students with high feedback literacy produce (Gielen et al., 2010). Knowledge and attitudes to not always translate into effective action (Becheikh et al., 2010; Huberman, 1990), and the quality of feedback that students actually produce play an important role in their learning from the process (Lu et al., 2023; Topping, 2023; Zheng et al., 2020; Zong et al., 2021a, b).
In order to make progress on behavioral indicators of peer feedback literacy, it is important to recognize a lack of agreement in the literature in defining the key aspects of “quality” of peer feedback. In fact, collectively, a large number of different conceptualizations and measures have been explored (Jin et al., 2022; Noroozi et al., 2022; Patchan et al., 2018; Tan & Chen, 2022), and their interrelationships have not been examined. Further, much of the literature to date has investigated peer feedback quality at the level of individual comments and ratings. Individual comments and ratings can be driven by characteristics of the object being studied, moment-to-moment fluctuations in attention and motivation, as well as feedback literacy of the reviewer. To understand the dimensionality of feedback literacy, investigations of reviewing quality must be conducted at the level of reviewers, not individual comments. For example, specific comment choices may have weak or even negative relationships based upon alternative structures (i.e., a reviewer might choose between two commenting strategies in a given comment), but at the individual level (as a reviewer) the same elements might be positively correlated reflecting more general attitudes or skills.
Integrating across many prior conceptualizations and empirical investigations, we propose a new conceptual framework that broadly encompasses many dimensions of reviewing quality. We then present an empirical investigation using multidimensional scaling and cluster analysis of the dimensionality of peer reviewing quality at the reviewer level (i.e., the behavioral component of peer feedback literacy), utilizing a large peer review dataset in a university-level course.
Literature review
While most studies of peer reviewing quality have tended to focus on one or two specific measures, a few authors considered peer reviewing quality more broadly. In building a tool for university computer science courses that automatically evaluates peer feedback quality, Ramachandran et al. (2017) proposed conceptualizing peer feedback quality in terms of six specific measures such as whether the feedback is aligned to the rubric dimensions, whether the feedback has a balanced tone, and whether the feedback was copied from another review. Since their focus was on tool building, they did not consider the dimensionality of the specific measures.
More recently, Zhang and Schunn (2023) proposed a five-dimensional conceptual framework for assessing the quality of peer reviews: accuracy, amount, impact, features, and content. The larger framework was not tested, and only a few specific measures were studied in university biology courses. Using a broader literature review, here we expand and refine this framework to include six dimensions: reviewing process, rating accuracy, amount, perceived comment quality, actual comment quality, and feedback content (see Table 1).
The first dimension, reviewing process, pertains to varying methods students use while reviewing, significantly affecting feedback quality. This includes aspects like time devoted to reviewing or use of drafting of comments. Studies conducted in a lab and on MOOCs found a positive correlation between efficient time management and improved review accuracy (Piech et al., 2013; Smith & Ratcliff, 2004). However, such easily-collected process measures may not accurately represent effective processes. For instance, time logged in an online system may not reflect actual working time. Indeed, another study found that spending slightly below-average time reviewing correlated with higher reliability (Piech et al., 2013). To address this concern, Xiong and Schunn (2021) focused on whether reviews were completed in extremely short durations (< 10 min) instead of measuring the total time spent on a review. Similarly, numerous revisions while completing a review could signify confusion rather than good process. Methods like eye-tracking (Bolzer et al., 2015) or think-aloud techniques (Wolfe, 2005) could provide additional measures related to peer reviewing processes.
The second dimension, rating accuracy, focuses on peer assessment and the alignment between a reviewers’ ratings and a document’s true quality. True document quality is ideally determined by expert ratings, but sometimes, more indirect measures like instructor or mean multi-peer ratings are used. Across varied terms like error, validity, or accuracy, the alignment of peer ratings with document quality is typically quantified either by measuring agreement (i.e., distance from expert ratings—Li et al., 2016; Xiong & Schunn, 2021) or by measuring evaluator consistency (i.e., having similar rating patterns across document and dimension—Schunn et al., 2016; Tong et al., 2023; Zhang et al., 2020). Past studies typically focused on specific indicators without examining their interrelations or their relationship with other dimensions of peer reviewing quality.
The third dimension, amount, can pertain to one peer feedback component (i.e., the number or length of comments in a review) or broadly to peer review (i.e., the number of reviews completed). Conceptually, this dimension may be especially driven by motivation levels and attitudes towards peer feedback, but the amount produced can also reflect understanding and expertise (Zong et al., 2022). Within amount, a distinction has been made between frequency—defined by the number of provided comments or completed reviews as a kind of behavioral engagement (Zong et al., 2021b; Zou et al., 2018)—and comment length, indicating cognitive engagement and learning value (Zong et al., 2021a). While comment length logically correlates with quality dimensions focused on the contents of a comment (i.e., adding explanations or potential solutions increases length), its associations with many other dimensions, like accuracy in ratings, reviewing process, or feedback content, remain unexplored.
The fourth dimension, perceived comment quality, focuses on various aspects of comments from the feedback recipient’s perspective; peer feedback is a form of communication, and recipients are well positioned to judge communication quality. This dimension may focus on the initial processing of the comment (e.g., was it understandable?; Nelson & Schunn, 2009) or its ultimate impact (e.g., was it accepted? was it helpful for revision? did the recipient learn something?; Huisman et al., 2018), typically measured using Likert scales. Modern online peer feedback systems used in university contexts often incorporate a step where feedback recipients rate the received feedback’s helpfulness (Misiejuk & Wasson, 2021). However, little research has explored the relation between perceived comment quality and other reviewing quality dimensions, especially at the grain size of a reviewer (e.g., do reviewers whose comments are seen as helpful tend to put more effort into reviewing, produce more accurate ratings, or focus on critical aspects of the document?).
The fifth dimension, actual comment quality, revolves around the comment’s objective impact (e.g., is it implementable or what is processed by the reviewer?) or concrete, structural elements influencing its impact (e.g., does it provide a solution, is the tone balanced, does it explain the problem?). This impact, or feedback uptake (Wichmann et al., 2018), typically pertains to the comment’s utilization in revisions (Wu & Schunn, 2021b). However, as comments might be ignored for reasons unrelated to their comment content (Wichmann et al., 2018), some studies focus upon potential impact (Cui et al., 2021; Leijen, 2017; Liu & Sadler, 2003; Wu & Schunn, 2023). Another approach examines comment features likely to influence their impact, like the inclusion of explanations, suggestions, or praise (Lu et al., 2023; Tan & Chen, 2022; Tan et al., 2023; Wu & Schunn, 2021a). Most studies on actual comment quality have explored how students utilize received feedback (van den Bos & Tan, 2019; Wichmann et al., 2018; Wu & Schunn, 2023), with much less attention given to how actual comment quality is related to other dimensions of feedback quality, particularly at the level of feedback providers (e.g., do reviewers who provide more explanations give more accurate ratings?).
The last dimension, feedback content, shifts from the structure of the comment (e.g., was it said in a useful way?) to the semantic topic of the content (i.e., was the comment about the right content?). Content dimensions explored thus far include whether the review comments were aligned with the rubric provided by the instructor (Ramachandran et al., 2017), whether they covered the whole object being reviewed (Ramachandran et al., 2017), whether they attend to the most problematic issues in the document from an expert perspective (e.g., Gao et al., 2019), whether they focused on pervasive/global issues (Patchan et al., 2018) or higher-order writing issues (van den Bos & Tan, 2019) rather than sentence level issues, whether the comments were self-plagiarized or copied from other reviewers (Ramachandran et al., 2017), or whether multiple peers also referred to these same issues (Leijen, 2017), which indicates that many readers find it problematic. It is entirely possible that reviewers give many well-structured comments but generally avoid addressing the most central or challenging issues in a document perhaps because those require more work or intellectual risk (Gao et al., 2019). It could be argued that high peer feedback literacy involves staying focused on critical issues. However, it is unknown whether reviewers who tend to give well-structured comments when provided a focused rubric tend to give more accurate ratings or address critical issues in the documents they are reviewing.
The present study
In the current study, we seek to expand upon existing research on peer reviewing quality by examining its multidimensional structure, at the reviewer level, in essence developing behavioral dimensions of peer review literacy. This exploration is critical for theoretical and practical reasons: the dimensionality of peer reviewing quality is foundational to conceptualizations of peer feedback literacy, sampling plans for studies of peer feedback literacy, and interventions designed to improve peer feedback literacy.
To make it possible to study many dimensions and specific measures of peer feedback quality at once, we leverage an existing dataset involving a university-level course in which different studies have collectively developed measures and data for a wide range of reviewing quality constructs. We further add a few measures that can be efficiently added using mathematical formulas. As a result, we are able to study five of the six dimensions (all but feedback content) and specifically eighteen specific measures. Our primary research question is: What is the interrelationship among different dimensions and measures of peer reviewing quality at the reviewer level? Specifically, we postulate that the five dimensions—reviewing process, rating accuracy, amount of feedback, perceived comment quality, and actual comment quality—are interconnected in strong ways within a dimension and in relatively weaker ways across dimensions.
Method
Participants
Participants were 844 students enrolled in an Advanced Placement course in writing at nine secondary schools distributed across the United States. Participants were predominately female (59%; 4% did not report gender) and Caucasian (55%), followed by Asian (12%), African American (7%), and Hispanic/Latino (7%; 19% did not report their ethnicity). The mean age was 17 years (SD = 1.8).
The Advanced Placement (AP) course is a higher education course aimed for advanced high school students who are ready for instruction at the higher education level, similar to cases in which advanced high school students attend a course at a local university. This course is typically taken by students who are only 1 year younger than first-year university students, the point at which this specific course is normally taken, and by students who are especially likely to go on to university and wanting to be able to get credit for university-level courses to reduce their university degree time and costs. Since student enrollment in higher education and studies of their behavior focus on their general level of proficiency rather than age, students in this course should be thought of as more similar to entry-level university students than they are to general high school students. Further, the course is designed and regulated by a national organization, the College Board, to be entirely equivalent to a university course in content and grading.
The AP English Language and Composition course focuses on argument and rhetorical elements of writing, equivalent to the first-writing course that is required at most universities in the US (College Board, 2021). For a study on peer feedback within this course context, students from a school were taught by the same teacher, interacting online for peer feedback activities. Nine eligible teachers with experience in teaching this AP course were recruited. The selected teachers met the following eligibility criteria: 1) they had previously taught the course; 2) they were teaching at least two sections of the course during the study period; 3) they agreed to participate in training on effective use of the online peer feedback approach and study requirements; 4) they were willing to assign a specific writing assignment to students and require peer feedback on that assignment using the online system; and 5) they collectively represented a diverse range of regions in the US and student demographics.
Materials
All data were collected via an online peer-reviewing system, Peerceptiv (https://peerceptiv.com; Schunn, 2016), a system predominantly used at the university level (Yu & Schunn, 2023). The system provided access to data organized by research ids to protect student privacy, and the Human Research Protection Office at the University of Pittsburgh approved research on this data.
The task involved analyzing rhetorical strategies in a provided persuasive essay, with the specific prompt from a prior year’s end-of-year test. Students needed to: 1) submit their own document using a pseudonym; 2) review at least four randomly-assigned peer documents and rate document quality using seven 7-point rubrics, along with providing comments supported by seven corresponding comment prompts; 3) back-evaluate the helpfulness of received comments using a 5-point scale; and 4) submit a revised document. Half the students used an experimental version of the system that necessitated the use of a revision planning tool to indicate which received comments would be implemented in the revision and their priority, on a 3-point scale.
Measures of reviewing quality
This study examined 18 measures of peer reviewing quality in five categories (see Table 2), utilizing both simple mathematics calculations (like mean rating and word count) and labor-intensive hand-coding for comment content analysis. The hand-coding was aggregated from four prior studies (Wu & Schunn, 2020a, b, 2021a, b). This analysis introduces new elements: novel measures (priority, agreement measures, number of features), integration of measures not previously examined together, and an analysis of the data aggregated to the reviewer-level data. The detailed hand coding processes are described in the prior publications. Here we give brief summaries of the measures and their coding reliabilities.
The amount and mean perceived comment quality measures were directly calculated by computer from the raw data. All the remaining measures involving data coded by a trained pool of four undergraduate research assistants and six writing experts (all with years of experience teaching writing and familiarity with specific writing assignment and associated reviewing rubrics used in the study). A given measure involved either undergraduate assistants or expertise depending upon the level of expertise required. Artifacts were coded by two individuals to assess reliability; discrepancies were resolved through discussion to improve data quality. Coding on each dimension for both research assistants and experts involved a training phase in which coders iteratively coded a subset of artifacts and discussed discrepancies/revised coding manuals until acceptable levels of reliability were obtained.
Before all hand-coding procedures, comments were segmented by idea units by a research assistant if a given textbox included comments about two or more different issues, resulting in 24,816 comments. Then, given the focus of the writing assignment on learning complex elements of writing, comments about low-level writing issues (i.e., typos, spelling, grammar) were excluded from further coding and data analysis, resulting in 20,912 high-level comments.
Reviewing process
The duration of the review process was determined by the recorded time interval between the point at which a document assigned for review was downloaded and the point at which the completed review was submitted. Reviews completed within a duration of less than 10 min were likely expedited, given the need to attend to seven dimensions, even for the expert evaluators (Xiong & Schunn, 2021). Here we used the converse, Not speeded, to refer to positive feedback quality.
Rating accuracy
As a reminder, both students and experts rated the quality of the documents submitted for peer review based on seven 1-to-7 scales. Accuracy was separately defined in terms of both rating agreement and rating consistency (Tong et al., 2023; Xiong & Schunn, 2021) and in regard to the standard of expert judgments and mean peer judgments. Expert judgments are considered the gold standard of validity, but mean peer judgments are often the only available standard in studies with very large datasets. In practice, expert ratings and mean peer ratings are often highly correlated (Li et al., 2016).
Expert agreement was calculated as the negative sum absolute value of the difference between the true document quality (assessed by the trained experts; kappa = 0.73) and each reviewer’s judgment of the document quality across the seven dimensions and documents. The peer agreement was calculated in the same way but used the mean ratings across the peers rather than the expert judgments. The negation was applied to the absolute error to create an accuracy measurement in which higher values indicated higher accuracy. A constant of 42 (maximum difference 6 * 7 dimensions) was added to minus the absolute error to make most values sit between 0 and 42, with 42 reflecting high accuracy.
The expert consistency was calculated as the linear correlation between true document quality (assessed by the trained experts) and each reviewer’s judgment of document quality across the seven dimensions. The peer consistency was calculated in the same way, but again using mean ratings across the peers instead of expert ratings. Values logically could vary between -1 and 1 (though rarely were valued negatively), with higher consistency values indicating higher accuracy.
Amount
Students were assigned a fixed number of documents to review but sometimes did not complete all the required reviews and sometimes completed extra reviews. Within a review, students had to give at least one comment for each of the seven dimensions, but they could give more than one comment for each dimension, and there was no required minimum or maximum length for a given comment. As a result, students could provide one or several comments, each consisting of a single word or several paragraphs. Prior research on peer feedback has found that comments involving more than 50 words typically include useful information for receivers (Wu & Schunn, 2020a) and tend to produce more learning for comment providers (Zong et al., 2022). Also, there may be a tradeoff in that students could submit fewer longer comments or more total comments. Thus, we also calculated the percentage of long comments: the total number of long comments (i.e., having more than 50 words) divided by the total number of comments. To capture the three main ways in which amount varied, we included the number of reviews completed for the peer assessment task (#Reviews), the mean number of comments (#Comments), the percentage of long comments (%Long comments).
Perceived comment quality
All students were required to judge the helpfulness of the comments they received on a 1-to-5 scale, and students using the experimental revision planning interface had to select the priority with which they would implement each comment on a 1-to-3 scale. Both sources of data address perceived comment quality, with one involving a mixture of the value of comments for revision and for learning, and the other focusing exclusively on whether comments were useful for revision. Thus, two measures were created, one based on mean comment helpfulness and the other based on mean comment implementation priority.
Actual comment quality
The measures of actual comment quality were based upon hand-coding by the experts and trained research assistants. The first approach to actual comment quality focused on the usefulness of the comments. The experts coded feedback in terms of implementation in three ways: implementable (Kappa = 0.92), implemented (Kappa = 0.76) and improvement (Kappa = 0.69). Implementable (N = 14,793) refers to whether the comments could be addressed in a revision (i.e., was not pure praise or just a summary of the author’s work). By contrast, implemented refers to whether the comment was incorporated in the submitted document revision: a change in the document was made that could be related to the provided comment (N = 11,252). Non implementable comments were coded, by definition, as not implemented.
The improvement value of comments was coded by the experts for how much the comment could improve document quality (N = 1,758; kappa = 0.69). The two points were given when addressing a comment would measurably improve the document’s quality on the given rubrics (e.g., moving from a 5 to a 7 on a scale). One point was awarded when addressing a comment could improve document quality in terms of the underlying rubric dimensions, but not by enough to be a measurable change on the 7-point rubric scale. No points were given when addressing a comment would not improve document quality, would make the document worse, or would involve both improvements and declines (Wu & Schunn, 2020b). Improvement was only coded for implementable comments.
Another approach to actual comment quality focused on specific feedback features that typically are helpful for revision or learning (Jin et al., 2022; Tan & Chen, 2022; Wu & Schunn, 2020a). Research assistants coded the comments for whether they provided a specific solution (Kappa = 0.76), gave a more general suggestion for how to address the problem but not an exact solution (Kappa = 0.79), explicitly identified the problem (Kappa = 0.81) and explained the problem (Kappa = 0.80). Separate measures were created for each feature, calculated as the percentage of comments having each feature. There was also an aggregate features measure, calculated as the mean number of features contained in each comment (#Features).
Data analysis
Table 4 in Appendix shows the descriptive information for all the measures of peer reviewing quality at the reviewer level. Because of the different data sources, Ns varied substantially across measures. In addition, some of the measures tended to have relatively high means with negative skews, like # of reviews, rating agreement and rating accuracy measures, and helpfulness. Other measures had low means and positive skews, like the specific comment features, %implemented, and mean improvement.
The peer reviewing measures were first analyzed for reliability across reviews. Conceptually, this analysis examines whether reviewers tended to give reviews of similar quality on a given measure across the reviews they completed on an assignment. It is possible that the reviewing quality was heavily influenced by characteristics of the object being reviewed (e.g., it is easier to include solutions for weaker documents), and thus not a measure of peer feedback literacy. Other incidental factors such as order of the reviews or presence of a distraction could also have mattered, but those factors likely would influence the reliability of all the measures rather than just isolated measures.
Reliability was measured via an Intraclass Correlation Coefficient (ICC). There are many forms of ICC. In terms of the McGraw and Wong (1996) framework, we used ICC(k), which represents the agreement reliability (meaning level of deviation from the same exact rating) across k ratings (typically 4 in our data) using a one-way random analysis, because each reviewer was given different documents to review from a larger population of possible documents (Koo & Li, 2016). We used the Landis and Koch (1977) guidelines for interpreting the ICC values for the reliabilty of the measures: almost perfect for values above 0.80; substantial for values from 0.61 to 0.80; moderate for values of 0.41 to 0.60; fair for values of 0.21 to 0.40; slight for values of 0.01 to 0.20, and poor for values less than 0.
Finally, to show the interrelationship among the variables, we conducted a three-step process of: 1) pairwise correlation among all measures with pairwise rather than listwise deletion given the high variability in measure Ns (see Figure 3 in Appendix for sample sizes); 2) multidimensional scaling (MDS) applied to the correlation data to visualize the relative proximity of the measures; and 3) a hierarchical cluster analysis applied to the results of the correlation matrix to extract conceptual clusters of measures. We conducted the analyses in R: pairwise correlations using the “GGally” package, multidimensional scaling using the “magrittr” package, and hierarchical clustering using the “stats” package. For the correlational analysis, we applied both linear and rank correlations since there were strong skews to some of the measures. The two approaches produced similar results.
Multidimensional scaling (MDS) is a statistical technique employed to visualize and analyze similarities or dissimilarities among variables in a dataset (Carroll & Arabie, 1998). While factor analysis is typically used to test or identify separable dimensions among many specific measures, MDS provides a useful visualization of the interrelationship of items, particularly when some items inherently straddle multiple dimensions. It also provides a useful visualization of the interrelationship of the dimensions rather than just of the items (Ding, 2006). The outcome of MDS is a “map” that represents these variables as points within a lower-dimensional space, typically two or three dimensions, while preserving the original distances between them as much as possible (Hout et al., 2013). In the current study, we chose two dimensions based on a scree plot of the eigenvalues associated with each MDS dimension (see Figure 4 in Appendix)—two dimensions offered a relatively good fit and is much easier to visualize. We expected measures within each conceptual dimension to sit close together on the MDS map.
Hierarchical cluster analysis, a general family of algorithms, is the dominant approach to grouping similar variables or data points based on their attributes or features (Murtagh & Contreras, 2017). It can accurately identify patterns within even small datasets (e.g., a 18*18 correlation matrix) since it leverages pairwise distances between all contributing measures. Further, it requires no assumptions about cluster shape, while other common algorithms like K-means assume that clusters are spherical and have similar sizes. However, we note that a K-means clustering algorithm produced similar clusters, so the findings are not heavily dependent upon the algorithm that was used. We expected to obtain the five clusters of dimensions as proposed in Table 2.
Results
We first focus on the reliability of each peer reviewing quality (defined by agreement in values across completed reviews). As shown by the blue cells along the main diagonal in Fig. 1, the measures #Comments, %Long comments, and %Suggestions showed perfect reliability [0.81, 0.95], and the rest of measures of peer reviewing quality, except Improvement, showed moderate to substantial reliability [0.48, 0.79]. Only the Improvement measure showed only a slight level of measure reliability across reviews. It is possible that Improvement is primarily driven by the document, perhaps because some documents have limited potential for improvement or that the scope for improvement relies heavily on the match between what the reviewer can perceive and the specific needs of the document. Taken together, all but one measures fell within the required range to be considered reliable, and the results involving the Improvement measure may be inconsistent due to measurement noise.

Measure reliability (diagonal cells and white font; / = NA) and linear inter-correlations (bold values for p < .05, and italic values for not significant values), organized by proposed peer feedback literacy dimension
The linear measure intercorrelation shown in Fig. 1 revealed that, except for Peer agreement, almost all measures were significantly and positively correlated with one another. Based on the patterns, one of the measures—%Long comment was removed from the amount dimension in the analyses that follow. Focusing on the rating accuracy measures, except for the correlations of Peer agreement with Expert consistency and Peer consistency with Expert agreement, all the correlations were positive and statistically significant. Further, the correlations with measures in other dimensions were often non-significant and always small: Peer agreement, Max out group = 0.18; Peer consistency, Max out group = 0.18; Expert Agreement, Max out group = 0.31; and Expert consistency, Max out group = 0.26. The largest cross-dimension correlations occurred for the two expert accuracy measures with actual comment quality measures such as %Implementable and Improvement. The results supported treating these measures as one dimension, even though the intercorrelations within the dimensions are relatively weak.
Turning to the amount dimension, we again note that %Long Comments only had weak correlations with #Reviews and #Comments (r = 0.15 and r = 0.1) compared to the relationship between #Reviews and #Comments (r = 0.63). After removing %Long Comments from the amount dimension, the in-group correlation (r = 0.63) was much higher than the out-group correlations (#Reviews, Max out group = 0.14; #Comments, Max out group = 0.20). Thus, the support for treating amount involving #Review and #Comment as a dimension was strong.
The support for a perceived quality dimension, as originally defined, was weak. The two measures correlated with one another at only r = 0.22. Correlations with measures in the amount and accuracy dimensions were also weak, but correlations with actual quality measures were often moderate. The results suggest some reorganization of the perceived and actual comment quality dimensions may be required.
Finally, the eight measures in the actual comment quality dimension were generally highly correlated with one another. Compared with out-group correlations, %Implementable (Min in group = 0.32 > Max out group = 0.31), %Implemented (Min in group = 0.41 > Max out group = 0.34), #Features (Min in group = 0.51 > Max out group = 0.39) and %Identifications (Min in group = 0.34 > Max out group = 0.25) were well nested in this group. However, some measures blurred somewhat with measures in the perceived comment quality dimension: Improvement (Min in group = 0.22 < Max out group = 0.28), %Solution (Min in group = 0.22 < Max out group = 0.28), %Suggestions (Min in group = 0.34 = Max out group = 0.34), %Explanations (Min in group = 0.34 < Max out group = 0.36). Overall, the correlation results revealed some overlap with perceived comment quality, particularly for %Solutions.
Further, to better understand the similarities among these measures, MDS and hierarchical cluster analysis were conducted based on measure intercorrelation data. The MDS results are shown in Fig. 2. Conceptually, the y-axis shows reviewing quality measures reflecting effort near the bottom (e.g., #Reviews and #Comments) and reviewing quality measures reflecting expertise near the top (e.g., the rating accuracy group and Improvement). By contrast, the x-axis involves review-level measures to the left and comment-level measures to the right. This pattern within the intercorrelations of measures illustrates what can be learned from MDS but would be difficult to obtain from factor analysis.

A map of peer feedback literacy based upon MDS and cluster analysis
The clustering algorithm produced five clusters, which are labeled and color-coded in Fig. 2. The five clusters were roughly similar to the originally hypothesized construct groups in Table 1, especially treating rating accuracy, amount, and reviewing process as distinct from each other and from perceived/actual comment quality. However, perceived and actual comment quality did not separate as expected. In particular, %Long comments and %Solutions were clustered together with helpfulness and priority. We call this new dimension Initial Impact, reflecting comment recipients’ initial reactions to feedback (without having to consider the feedback in light of the document). The remaining measures that were all proposed to be part of the actual comment quality dimension clustered together. We propose calling this dimension Ultimate Impact, reflecting their closer alignment with actual improvements and the aspects of comments are most likely to lead to successful revisions.
General discussion
Understanding the fundamental structure of peer review literacy from a behavioral/skills perspective, rather than a knowledge and attitudes perspective, was a fundamental goal of our study. With the support of online tools, peer feedback is becoming increasingly implemented in a wide range of educational levels, contexts, disciplines, course types, and student tasks. As a form of student-centered instruction, it has great potential to improve learning outcomes, but then also critically depends upon effective full participation by students in their reviewing roles. Thus, it is increasingly important to fully conceptualize and develop methods for studying and supporting peer feedback literacy.
Our proposed framework sought to build a coherent understanding of peer reviewing quality in terms of six dimensions—reviewing process, rating accuracy, feedback amount, perceived comment quality, actual comment quality, and feedback content—offering a unified perspective on the scattered and fragmented notions of peer reviewing quality (Ramachandran et al., 2017; Yu et al., 2023). Consolidating the disparate measures from the literature into dimensions serves many purposes. For example, when university educators understand the intricacies of the reviewing process, they can provide clearer guidance and training to students, improving the quality of feedback provided. Similarly, understanding the dimensional structure can organize investigations of what dimensions are shaped by various kinds of supports/training, and which dimensions influence later learning outcomes, either for the reviewer or the reviewee.
Unlike previous studies that primarily explored relationships among reviewing quality dimensions at the comment level (Leijen, 2017; Misiejuk et al., 2021; Wu & Schunn, 2021b), our work focuses on the reviewer level, as an approach to studying the behavioral elements of peer feedback literacy, complementing the predominantly knowledge and attitudes focus of interview and survey studies on peer feedback literacy. This shift in level of analysis is important because reviewing quality measures at the comment level might exhibit weak or even negative relationships due to varied structures or intentions. However, at the reviewer level, these measures may exhibit positive correlations, reflecting overarching strategies, motivations, or skills.
Our findings, as illustrated by the linear intercorrelation analysis, illuminate the interconnectedness of various factors shaping peer feedback literacy. The overarching theme emerging from the analysis is inherent multidimensionality, a facet of peer review literacy that has been previously highlighted in the literature (Winstone & Carless, 2020). The findings from the current study also suggest that peer feedback literacy can be organized into relative emphasis on expertise vs. effort and relative focus on review level vs. comment level aspects. It will be especially interesting to examine the ways in which training and motivational interventions will shape those different behavioral indicators.
It is important to note that survey-based measures of peer feedback literacy find that all of the dimensions identified within those studies were strongly correlated with one another (e.g., Dong et al., 2023) to the extent that the pragmatic and theoretical value of measuring them separately could be questioned. For example, feedback-related knowledge and willingness to participate in peer feedback were correlated at r = 0.76, and all the specific indicators on those scales loaded at high levels on their factors. Within our framework, those factors could be framed as representing the expertise vs. effort ends of the literacy continuum, which our findings suggest should be much more distinguishable than r = 0.76. Indeed, we also found dimensional structure to peer feedback literacy, but the correlations among dimensions are quite low, and even the correlations among different measures within a dimension were modest. If survey measures are going to be used in future studies on peer feedback literacy, it will be important to understand how well they align with students’ actual behaviors. Further, it may be necessary to extend what kinds of behaviors are represented on those surveys.
Our findings also suggest a strong separation of ratings accuracy from the impact that comments will have on their recipients. While there is some relationship among the two, particularly when focusing on expert evaluations of ratings accuracy and expert judgments of the improvement that comments will produce, the r = 0.26 correlation is quite modest. Both constructs represent a kind of expertise in the reviewer. But ratings accuracy represents attending to and successfully diagnosing all the relative strengths and weaknesses in a submission (i.e., having a review level competence), whereas improvements offered in comments can involve more focus on particular problems, not requiring a reviewer to be broadly proficient (i.e., having a comment level competence). In addition, especially useful comments require not only diagnosing a major problem but also offering strategies addressing that problem.
Our findings also help to situate specific measures of feedback quality that have drawn increasing attention given their pragmatic value in data collection and data analysis: comment helpfulness ratings and %long comments. On the one hand, they are central measures of the larger landscape of peer feedback quality. On the other hand, the only represent one dimension of peer feedback literacy: the initial impact of the comments being produced. Adding in rating accuracy measures like peer agreement or peer consistency and amount measures likes # of reviews and # of comments, would provide a broader measurement of peer feedback literacy while still involving easy to collect and analyze measures. To capture the ultimate impact dimension, studies would need to invest in the laborious task of hand coding comments (which is still much less laborious than hand coding implementation or expensive than expert coding of improvement) or perhaps turn to innovations in NLP and generative AI to automatically code large numbers of comments.
Limitations and future directions
We note two key limitations to our current study. First, the exclusion of the feedback content dimension potentially left out a critical element of the peer reviewing process, which future research should aim to incorporate, possibly being implemented with larger datasets like the current study through automated techniques like Natural Language Processing (Ramachandran et al., 2017). Such technological advances could reveal hidden patterns and correlations with the feedback content, potentially leading to a more comprehensive understanding of peer reviewing quality.
Furthermore, the geographical and contextual constraints of our study—specifically to an introductory university writing course in the US using one online peer feedback system—may limit the generalizability of our findings. Past meta-analyses and meta-regressions suggest minimal impact of discipline, class size, or system setup on the validity of peer review ratings or the derived learning benefits (Li et al., 2016; Sanchez et al., 2017; Yu & Schunn, 2023). However, it is important to replicate these novel findings of this study across various contexts.
Conclusion
Our investigation sought to investigate the dimensionality of peer feedback literacy, a common concern in ongoing research in this domain. In previous studies, the dimensionality of peer feedback literacy has been largely shaped by data from interviews and surveys (e.g., Dong et al., 2023; Zhan, 2022). These approaches offered valuable insights into domains of learners’ knowledge and attitudes towards peer feedback (e.g., willingness to participate in peer feedback is separable from appreciation of its value or knowledge of how to participate). But such studies provided little insight into the ways in which the produced feedback varied in quality, which can be taken as the behavioral dimensions of peer feedback literacy (Gielen et al., 2010). It is important to note that knowledge and attitudes do not always lead to effective action (Becheikh et al., 2010; Huberman, 1990). Further, the actual quality of feedback generated by students is crucial for their learning through the process (Lu et al., 2023; Topping, 2023; Zheng et al., 2020; Zong et al., 2021a, b). In the current study, we have clarified the dimensionality of the behavioral dimension, highlighting motivational vs. expertise elements at review and comment levels. These findings can become the new foundations of empirical investigations and theoretical development into the causes and consequences of peer feedback literacy.
The current findings offer actionable recommendations for practitioners (e.g., instructors, teaching assistants, instructional designers, online tool designers) for enhancing peer review processes. First, our findings identify four major areas in which practitioners need to scaffold peer reviewing quality: rating accuracy, the volume of feedback, the initial impact of comments, and the ultimate impact of comments. Different approaches are likely required to address these major areas given their relative emphasis on effort vs. expertise. For example, motivational scaffolds and considerations (e.g., workload) may be needed for improving volume of feedback, back-evaluations steps for improvement of initial impact, training on rubric dimensions for improvement of rating accuracy, and training on effective feedback structure for improvement of ultimate impact. Secondly, when resources are very constrained such that assessing the more labor-intensive dimensions of feedback quality is not possible, the multidimensional scale results suggest that length of comments and helpfulness ratings can be taken as an efficiently assessed proxy for overall feedback quality involving a mixture of effort and expertise at the review and comment levels.
Availability of data and materials
The data used to support the findings of this study are available from the corresponding author upon request.
References
Becheikh, N., Ziam, S., Idrissi, O., Castonguay, Y., & Landry, R. (2010). How to improve knowledge transfer strategies and practices in education? Answers from a systematic literature review. Research in Higher Education Journal, 7, 1–21.
Bolzer, M., Strijbos, J. W., & Fischer, F. (2015). Inferring mindful cognitive-processing of peer-feedback via eye-tracking: Role of feedback-characteristics, fixation-durations and transitions. Journal of Computer Assisted Learning, 31(5), 422–434.
Carroll, J. D., & Arabie, P. (1998). Multidimensional scaling. Measurement, Judgment and Decision Making, 179–250. https://www.sciencedirect.com/science/article/abs/pii/B9780120999750500051
Cheng, K. H., & Hou, H. T. (2015). Exploring students’ behavioural patterns during online peer assessment from the affective, cognitive, and metacognitive perspectives: A progressive sequential analysis. Technology, Pedagogy and Education, 24(2), 171–188.
College Board. (2021). Program summary report. https://reports.collegeboard.org/media/pdf/2021-ap-program-summary-report_1.pdf
Cui, Y., Schunn, C. D., Gai, X., Jiang, Y., & Wang, Z. (2021). Effects of trained peer vs. Teacher feedback on EFL students’ writing performance, self-efficacy, and internalization of motivation. Frontiers in Psychology, 12, 5569.
Darvishi, A., Khosravi, H., Sadiq, S., & Gašević, D. (2022). Incorporating AI and learning analytics to build trustworthy peer assessment systems. British Journal of Educational Technology, 53(4), 844–875.
Dawson, P., Yan, Z., Lipnevich, A., Tai, J., Boud, D., & Mahoney, P. (2023). Measuring what learners do in feedback: The feedback literacy behaviour scale. Assessment & Evaluation in Higher Education, Advanced Published Online. https://doi.org/10.1080/02602938.2023.2240983
Ding, C. S. (2006). Multidimensional scaling modelling approach to latent profile analysis in psychological research. International Journal of Psychology, 41(3), 226–238.
Dong, Z., Gao, Y., & Schunn, C. D. (2023). Assessing students’ peer feedback literacy in writing: Scale development and validation. Assessment & Evaluation in Higher Education, 48(8), 1103–1118.
Gao, Y., Schunn, C. D. D., & Yu, Q. (2019). The alignment of written peer feedback with draft problems and its impact on revision in peer assessment. Assessment & Evaluation in Higher Education, 44(2), 294–308.
Gao, X., Noroozi, O., Gulikers, J. T. M., Biemans, H. J., & Banihashem, S. K. (2023). A systematic review of the key components of online peer feedback practices in higher education. Educational Research Review, 42, 100588.
Gielen, S., Peeters, E., Dochy, F., Onghena, P., & Struyven, K. (2010). Improving the effectiveness of peer feedback for learning. Learning and Instruction, 20(4), 304–315.
Hattie, J., & Timperley, H. (2007). The power of feedback. Review of Educational Research, 77(1), 81–112.
Hout, M. C., Papesh, M. H., & Goldinger, S. D. (2013). Multidimensional scaling. Wiley Interdisciplinary Reviews: Cognitive Science, 4(1), 93–103.
Howard, C. D., Barrett, A. F., & Frick, T. W. (2010). Anonymity to promote peer feedback: Pre-service teachers’ comments in asynchronous computer-mediated communication. Journal of Educational Computing Research, 43(1), 89–112.
Huberman, M. (1990). Linkage between researchers and practitioners: A qualitative study. American Educational Research Journal, 27(2), 363–391.
Huisman, B., Saab, N., Van Driel, J., & Van Den Broek, P. (2018). Peer feedback on academic writing: Undergraduate students’ peer feedback role, peer feedback perceptions and essay performance. Assessment & Evaluation in Higher Education, 43(6), 955–968.
Jin, X., Jiang, Q., Xiong, W., Feng, Y., & Zhao, W. (2022). Effects of student engagement in peer feedback on writing performance in higher education. Interactive Learning Environments, 32(1), 128–143.
Kerman, N. T., Banihashem, S. K., Karami, M., Er, E., Van Ginkel, S., & Noroozi, O. (2024). Online peer feedback in higher education: A synthesis of the literature. Education and Information Technologies, 29(1), 763–813.
Koo, T. K., & Li, M. Y. (2016). A guideline of selecting and reporting intraclass correlation coefficients for reliability research. Journal of Chiropractic Medicine, 15(2), 155–163.
Landis, J. R., & Koch, G. G. (1977). The measurement of observer agreement for categorical data. Biometrics, 33(1), 159–174.
Leijen, D. A. (2017). A novel approach to examine the impact of web-based peer review on the revisions of L2 writers. Computers and Composition, 43, 35–54.
Li, H., Xiong, Y., Zang, X., Kornhaber, M. L., Lyu, Y., Chung, K. S., & Suen, H. K. (2016). Peer assessment in the digital age: A meta-analysis comparing peer and teacher ratings. Assessment & Evaluation in Higher Education, 41(2), 245–264.
Little, T., Dawson, P., Boud, D., & Tai, J. (2024). Can students’ feedback literacy be improved? A scoping review of interventions. Assessment & Evaluation in Higher Education, 49(1), 39–52.
Liu, J., & Sadler, R. W. (2003). The effect and affect of peer review in electronic versus traditional modes on L2 writing. Journal of English for Academic Purposes, 2(3), 193–227.
Lu, Q., Yao, Y., & Zhu, X. (2023). The relationship between peer feedback features and revision sources mediated by feedback acceptance: The effect on undergraduate students’ writing performance. Assessing Writing, 56, 100725.
Lu, Q., Zhu, X., & Cheong, C. M. (2021). Understanding the difference between self-feedback and peer feedback: A comparative study of their effects on undergraduate students' writing improvement. Frontiers in psychology, 12, 739962.
Man, D., Kong, B., & Chau, M. (2022). Developing student feedback literacy through peer review training. RELC Journal. Advanced Published Online. https://doi.org/10.1177/00336882221078380
McGraw, K. O., & Wong, S. P. (1996). Forming inferences about some intraclass correlation coefficients. Psychological Methods, 1(1), 30–46.
Misiejuk, K., Wasson, B., & Egelandsdal, K. (2021). Using learning analytics to understand student perceptions of peer feedback. Computers in human behavior, 117, 106658.
Misiejuk, K., & Wasson, B. (2021). Backward evaluation in peer assessment: A scoping review. Computers & Education, 175, 104319.
Murtagh, F., & Contreras, P. (2017). Algorithms for hierarchical clustering: An overview, II. Wiley Interdisciplinary Reviews: Data Mining and Knowledge Discovery, 7(6), e1219.
Nelson, M. M., & Schunn, C. D. (2009). The nature of feedback: How different types of peer feedback affect writing performance. Instructional Science, 37, 375–401.
Nieminen, J. H., & Carless, D. (2023). Feedback literacy: A critical review of an emerging concept. Higher Education, 85(6), 1381–1400.
Noroozi, O., Banihashem, S. K., Taghizadeh Kerman, N., Parvaneh Akhteh Khaneh, M., Babayi, M., Ashrafi, H., & Biemans, H. J. (2022). Gender differences in students’ argumentative essay writing, peer review performance and uptake in online learning environments. Interactive Learning Environments, 31(10), 6302–6316.
Patchan, M. M., Schunn, C. D., & Clark, R. J. (2018). Accountability in peer assessment: Examining the effects of reviewing grades on peer ratings and peer feedback. Studies in Higher Education, 43(12), 2263–2278.
Piech, C., Huang, J., Chen, Z., Do, C., Ng, A., & Koller, D. (2013). Tuned models of peer assessment in MOOCs. In Proceedings of the 6th international conference on educational data mining (EDM 2013)
Raes, A., Vanderhoven, E., & Schellens, T. (2013). Increasing anonymity in peer assessment by using classroom response technology within face-to-face higher education. Studies in Higher Education, 40(1), 178–193.
Ramachandran, L., Gehringer, E. F., & Yadav, R. K. (2017). Automated assessment of the quality of peer reviews using natural language processing techniques. International Journal of Artificial Intelligence in Education, 27, 534–581.
Rietsche, R., Caines, A., Schramm, C., Pfütze, D., & Buttery, P. (2022). The specificity and helpfulness of peer-to-peer feedback in higher education. In Proceedings of the 17th Workshop on Innovative Use of NLP for Building Educational Applications (BEA 2022) (pp. 107–117).
Sanchez, A., Romero, N., & De Raedt, R. (2017). Depression-related difficulties disengaging from negative faces are associated with sustained attention to negative feedback during social evaluation and predict stress recovery. PLoS One, 12(3), e0175040.
Schunn, C., Godley, A., & DeMartino, S. (2016). The reliability and validity of peer review of writing in high school AP English classes. Journal of Adolescent & Adult Literacy, 60(1), 13–23.
Schunn, C. D. (2016). Writing to learn and learning to write through SWoRD. In S. A. Crossley & D. S. McNamara (Eds.), Adaptive educational technologies for literacy instruction. Taylor & Francis, Routledge.
Smith, P. L., & Ratcliff, R. (2004). Psychology and neurobiology of simple decisions. Trends in Neurosciences, 27(3), 161–168.
Sutton, P. (2012). Conceptualizing feedback literacy: Knowing, being, and acting. Innovations in Education and Teaching International, 49(1), 31–40.
Tan, J. S., & Chen, W. (2022). Peer feedback to support collaborative knowledge improvement: What kind of feedback feed-forward? Computers & Education, 187, 104467.
Tan, J. S., Chen, W., Su, J., & Su, G. (2023). The mechanism and effect of class-wide peer feedback on conceptual knowledge improvement: Does different feedback type matter?. International Journal of Computer-Supported Collaborative Learning, 18, 393–424.
Tong, Y., Schunn, C. D., & Wang, H. (2023). Why increasing the number of raters only helps sometimes: Reliability and validity of peer assessment across tasks of different complexity. Studies in Educational Evaluation, 76, 101233.
Topping, K. J. (2023). Advantages and disadvantages of online and Face-to-Face peer learning in higher education: A review. Education Sciences, 13(4), 326. https://doi.org/10.3390/educsci13040326
van den Bos, A. H., & Tan, E. (2019). Effects of anonymity on online peer review in second-language writing. Computers & Education, 142, 103638.
Wichmann, A., Funk, A., & Rummel, N. (2018). Leveraging the potential of peer feedback in an academic writing activity through sense-making support. European Journal of Psychology of Education, 33, 165–184.
Winstone, N., & Carless, D. (2020). Designing effective feedback processes in higher education: A learner-centred approach. Innovations in education and teaching international, 57(3), 386–387.
Woitt, S., Weidlich, J., Jivet, I., Orhan Göksün, D., Drachsler, H., & Kalz, M. (2023). Students’ feedback literacy in higher education: an initial scale validation study. Teaching in Higher Education, Advanced Published Online. https://doi.org/10.1080/13562517.2023.2263838
Wolfe, E. M. (2005). Uncovering rater’s cognitive processing and focus using think-aloud protocols. Journal of Writing Assessment, 2(1), 37–56.
Wu, Y., & Schunn, C. D. (2020a). From feedback to revisions: Effects of feedback features and perceptions. Contemporary Educational Psychology, 60, 101826.
Wu, Y., & Schunn, C. D. (2020b). When peers agree, do students listen? The central role of feedback quality and feedback frequency in determining uptake of feedback. Contemporary Educational Psychology, 62, 101897.
Wu, Y., & Schunn, C. D. (2021a). The effects of providing and receiving peer feedback on writing performance and learning of secondary school students. American Educational Research Journal, 58(3), 492–526.
Wu, Y., & Schunn, C. D. (2021b). From plans to actual implementation: A process model for why feedback features influence feedback implementation. Instructional Science, 49(3), 365–394.
Wu, Y., & Schunn, C. D. (2023). Assessor writing performance on peer feedback: Exploring the relation between assessor writing performance, problem identification accuracy, and helpfulness of peer feedback. Journal of Educational Psychology, 115(1), 118–142.
Xiong, W., & Litman, D. (2011). Understanding differences in perceived peer-review helpfulness using natural language processing. In Proceedings of the sixth workshop on innovative use of NLP for building educational applications (pp. 10–19).
Xiong, Y., & Schunn, C. D. (2021). Reviewer, essay, and reviewing-process characteristics that predict errors in web-based peer review. Computers & Education, 166, 104146.
Yu, Q., & Schunn, C. D. (2023). Understanding the what and when of peer feedback benefits for performance and transfer. Computers in Human Behavior, 147, 107857.
Yu, F. Y., Liu, Y. H., & Liu, K. (2023). Online peer-assessment quality control: A proactive measure, validation study, and sensitivity analysis. Studies in Educational Evaluation, 78, 101279.
Zhan, Y. (2022). Developing and validating a student feedback literacy scale. Assessment & Evaluation in Higher Education, 47(7), 1087–1100.
Zhang, Y., & Schunn, C. D. (2023). Self-regulation of peer feedback quality aspects through different dimensions of experience within prior peer feedback assignments. Contemporary Educational Psychology, 74, 102210.
Zhang, F., Schunn, C., Li, W., & Long, M. (2020). Changes in the reliability and validity of peer assessment across the college years. Assessment & Evaluation in Higher Education, 45(8), 1073–1087.
Zheng, L., Zhang, X., & Cui, P. (2020). The role of technology-facilitated peer assessment and supporting strategies: A meta-analysis. Assessment & Evaluation in Higher Education, 45(3), 372–386.
Zong, Z., Schunn, C. D., & Wang, Y. (2021a). What aspects of online peer feedback robustly predict growth in students’ task performance? Computers in Human Behavior, 124, 106924.
Zong, Z., Schunn, C. D., & Wang, Y. (2021b). Learning to improve the quality peer feedback through experience with peer feedback. Assessment & Evaluation in Higher Education, 46(6), 973–992.
Zong, Z., Schunn, C., & Wang, Y. (2022). What makes students contribute more peer feedback? The role of within-course experience with peer feedback. Assessment & Evaluation in Higher Education, 47(6), 972–983.
Zou, Y., Schunn, C. D., Wang, Y., & Zhang, F. (2018). Student attitudes that predict participation in peer assessment. Assessment & Evaluation in Higher Education, 43(5), 800–811.
Acknowledgements
Not applicable.
Funding
This study was supported by the Philosophy and Social Sciences Planning Youth Project of Guangdong Province under grant [GD24YJY01], and The National Social Science Fund of China [23BYY154].
Author information
Authors and Affiliations
Contributions
Yi Zhang: Conceptualization, Methodology, Data Curation, Writing - Original Draft, Revision. Christian D. Schunn: Conceptualization, Visualization, Methodology, Supervision, Revision. Yong Wu: Data Curation, Conceptualization, Investigation.
Corresponding author
Ethics declarations
Competing interests
There is no conflict of interest, as we conducted this study only as part of our research program.
The second author is a co-inventor of the peer review system used in the study.
Additional information
Publisher’s Note
Springer Nature remains neutral with regard to jurisdictional claims in published maps and institutional affiliations.
Appendix
Appendix

The sample size for each pairwise correlation
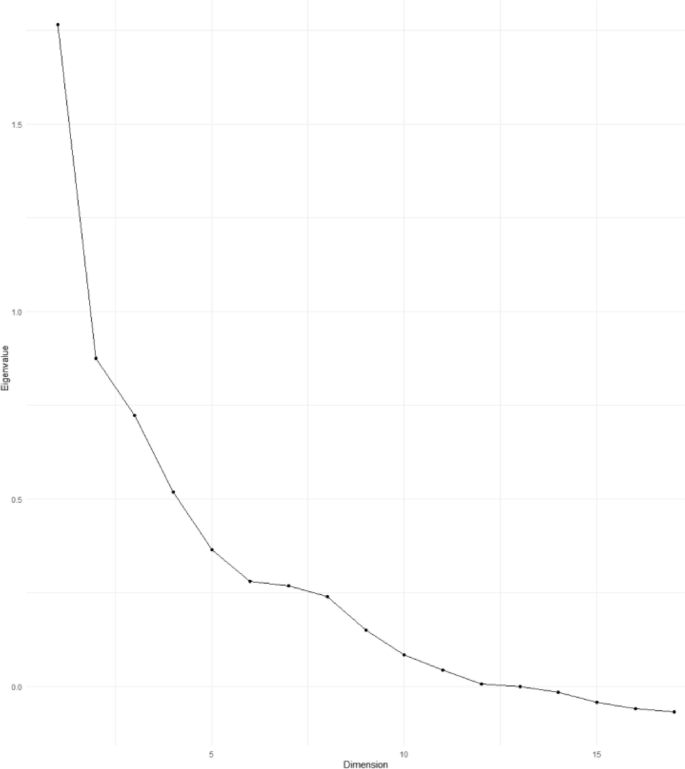
Scree plot for MDS
Rights and permissions
Open Access This article is licensed under a Creative Commons Attribution 4.0 International License, which permits use, sharing, adaptation, distribution and reproduction in any medium or format, as long as you give appropriate credit to the original author(s) and the source, provide a link to the Creative Commons licence, and indicate if changes were made. The images or other third party material in this article are included in the article's Creative Commons licence, unless indicated otherwise in a credit line to the material. If material is not included in the article's Creative Commons licence and your intended use is not permitted by statutory regulation or exceeds the permitted use, you will need to obtain permission directly from the copyright holder. To view a copy of this licence, visit http://creativecommons.org/licenses/by/4.0/.
About this article

Cite this article
Zhang, Y., Schunn, C.D. & Wu, Y. What does it mean to be good at peer reviewing? A multidimensional scaling and cluster analysis study of behavioral indicators of peer feedback literacy. Int J Educ Technol High Educ 21, 26 (2024). https://doi.org/10.1186/s41239-024-00458-1
Received:
Accepted:
Published:
DOI: https://doi.org/10.1186/s41239-024-00458-1