- Review Article
- Open access
- Published:
Teaching analytics, value and tools for teacher data literacy: a systematic and tripartite approach
International Journal of Educational Technology in Higher Education volume 17, Article number: 22 (2020)
Abstract
Teaching Analytics (TA) is a new theoretical approach, which combines teaching expertise, visual analytics and design-based research to support teacher’s diagnostic pedagogical ability to use data and evidence to improve the quality of teaching. TA is now gaining prominence because it offers enormous opportunities to the teachers. It also identifies optimal ways in which teaching performance can be enhanced. Further, TA provides a platform for teachers to use data to reflect on teaching outcome. The outcome of TA can be used to engage teachers in a meaningful dialogue to improve the quality of teaching. Arguably, teachers need to develop their teacher data literacy and data inquiry skills to learn about teaching challenges. These skills are dependent on understanding the connection between TA, LA and Learning Design (LD). Additionally, they need to understand how choices in particular pedagogues and the LD can enhance their teaching experience. In other words, teachers need to equip themselves with the knowledge necessary to understand the complexity of teaching and the learning environment. Providing teachers access to analytics associated with their teaching practice and learning outcome can improve the quality of teaching practice. This research aims to explore current TA related discussions in the literature, to provide a generic conception of the meaning and value of TA. The review was intended to inform the establishment of a framework describing the various aspects of TA and to develop a model that can enable us to gain more insights into how TA can help teachers improve teaching practices and learning outcome. The Tripartite model was adopted to carry out a comprehensive, systematic and critical analysis of the literature of TA. To understand the current state-of-the-art relating to TA, and the implications to the future, we reviewed published articles from the year 2012 to 2019. The results of this review have led to the development of a conceptual framework for TA and established the boundaries between TA and LA. From the analysis the literature, we proposed a Teaching Outcome Model (TOM) as a theoretical lens to guide teachers and researchers to engage with data relating to teaching activities, to improve the quality of teaching.
Introduction
Educational institutions today are operating in an information era, where machines automatically generate data rather than manually; hence, the emergence of big data in education (Daniel 2015). The phenomenon of analytics seeks to acquire insightful information from data that ordinarily would not be visible by the ordinary eyes, except with the application of state-of-the-art models and methods to reveal hidden patterns and relationships in data. Analytics plays a vital role in reforming the educational sector to catch up with the fast pace at which data is generated, and the extent to which such data can be used to transform our institutions effectively. For example, with the extensive use of online and blended learning platforms, the application of analytics will enable educators at all levels to gain new insights into how people learn and how teachers can teach better. However, the current discourses on the use of analytics in Higher Education (HE) are focused on the enormous opportunities analytics offer to various stakeholders; including learners, teachers, researchers and administrators.
In the last decade, extensive literature has proposed two weaves of analytics to support learning and improve educational outcomes, operations and processes. The first form of Business Intelligence introduced in the educational industry is Academic Analytics (AA). AA describes data collected on the performance of academic programmes to inform policy. Then, Learning Analytics (LA), emerged as the second weave of analytics, and it is one of the fastest-growing areas of research within the broader use of analytics in the context of education. LA is defined as the "measurement, collection, analysis and reporting of data about the learner and their learning contexts for understanding and optimising learning and the environments in which it occurs" (Elias 2011). LA was introduced to attend to teaching performance and learning outcome (Anderson 2003; Macfadyen and Dawson 2012). Typical research areas in LA, include student retention, predicting students at-risk, personalised learning which in turn are highly student-driven (Beer et al. 2009; Leitner et al. 2017; Pascual-Miguel et al. 2011; Ramos and Yudko 2008). For instance, Griffiths (Griffiths 2017), employed LA to monitor students’ engagements and behavioural patterns on a computer-supported collaborative learning environment to predict at-risk students. Similarly, Rienties et al. (Rienties et al. 2016) looked at LA approaches in their capacity to enhance the learner’s retention, engagement and satisfaction. However, in the last decade, LA research has focused mostly on the learner and data collections, based on digital data traces from Learning Management Systems (LMS) (Ferguson 2012), not the physical classroom.
Teaching Analytics (TA) is a new theoretical approach that combines teaching expertise, visual analytics and design-based research, to support the teacher with diagnostic and analytic pedagogical ability to improve the quality of teaching. Though it is a new phenomenon, TA is now gaining prominence because it offers enormous opportunities to the teachers.
Research on TA pays special attention to teacher professional practice, offering data literacy and visual analytics tools and methods (Sergis et al. 2017). Hence, TA is the collection and use of data related to teaching and learning activities and environments to inform teaching practice and to attain specific learning outcomes. Some authors have combined the LA, and TA approaches into Teaching and Learning Analytics (TLA) (Sergis and Sampson 2017; Sergis and Sampson 2016). All these demonstrate the rising interest in collecting evidence from educational settings for awareness, reflection, or decision making, among other purposes. However, the most frequent data that have been collected and analysed about TA focus on the students (e.g., different discussion and learning activities and some sensor data such as eye-tracking, position or physical actions) (Sergis and Sampson 2017), rather than monitoring teacher activities. Providing teachers access to analytics of their teaching, and how they can effectively use such analytics to improve their teaching process is a critical endeavour. Also, other human-mediated data gathering in the form of student feedback, self and peer observations or teacher diaries can be employed to enrich TA further. For instance, visual representations such as dashboards can be used to present teaching data to help teachers reflect and make appropriate decisions to inform the quality of teaching. In other words, TA can be regarded as a reconceptualisation of LA for teachers to improve teaching performance and learning outcome. The concept of TA is central to the growing data-rich technology-enhanced learning and teaching environment (Flavin 2017; Saye and Brush 2007). Further, it provides teachers with the opportunity to engage in data-informed pedagogical improvement.
While LA is undeniably an essential area of research in educational technology and the learning sciences, automatically extracted data from an educational platform mainly provide an overview of student activities, and participation. Nevertheless, it hardly indicates the role of the teacher in these activities, or may not otherwise be relevant to teachers’ individual needs (for Teaching Professional Development (TPD) or improvement of their classroom practice). Many teachers generally lack adequate data literacy skills (Sun et al. 2016). Teacher data literacy skill and teacher inquiry skill using data are the foundational concepts underpinning TA (Kaser and Halbert 2014). The development of these two skills is dependent on understanding the connection between TA, LA and Learning Design (LD). In other words, teachers need to equip themselves with knowledge through interaction with sophisticated data structures and analytics. Hence, TA is critical to improving teachers’ low efficacy towards educational data.
Additionally, technology has expanded the horizon of analytics to various forms of educational settings. As such, the educational research landscape needs efficient tools for collecting data and analyzing data, which in turn requires explicit guidance on how to use the findings to inform teaching and learning (McKenney and Mor 2015). Increasing the possibilities for teachers to engage with data to assess what works for the students and courses they teach is instrumental to quality (Van Harmelen and Workman 2012). TA provides optimal ways of performing the analysis of data obtained from teaching activities and the environment in which instruction occurs. Hence, more research is required to explore how teachers can engage with data associated with teaching to encourage teacher reflection, improve the quality of teaching, and provide useful insights into ways teachers could be supported to interact with teaching data effectively. However, it is also essential to be aware that there are critical challenges associated with data collection. Moreover, designing the information flow that facilitates evidence-based decision-making requires addressing issues such as the potential risk of bias; ethical and privacy concerns; inadequate knowledge of how to engage with analytics effectively.
To ensure that instructional design and learning support is evidence-based, it is essential to empower teachers with the necessary knowledge of analytics and data literacy. The lack of such knowledge can lead to poor interpretation of analytics, which in turn can lead to ill-informed decisions that can significantly affect students; creating more inequalities in access to learning opportunities and support regimes. Teacher data literacy refers to a teachers’ ability to effectively engage with data and analytics to make better pedagogical decisions.
The primary outcome of TA is to guide educational researchers to develop better strategies to support the development of teachers’ data literacy skills and knowledge. However, for teachers to embrace data-driven approaches to learning design, there is a need to implement bottom-up approaches that include teachers as main stakeholders of a data literacy project, rather than end-users of data.
The purpose of this research is to explore the current discusses in the literature relating to TA. A vital goal of the review was to extend our understanding of conceptions and value of TA. Secondly, we want to contextualise the notion of TA and develop various concepts around TA to establish a framework that describes multiple aspects of TA. Thirdly, to examine different data collections/sources, machine learning algorithms, visualisations and actions associated with TA. The intended outcome is to develop a model that would provide a guide for the teacher to improve teaching practice and ultimately enhance learning outcomes.
The research employed a systematic and critical analysis of articles published from the year 2012 to 2019. A total of 58 publications were initially identified and compiled from the Scopus database. After analysing the search results, 31 papers were selected for review. This review examined research relating to the utilisation of analytics associated with teaching and teacher activities and provided conceptual clarity on TA. We found that the literature relating to conception, and optimisation of TA is sporadic and scare, as such the notion of TA is theoretically underdeveloped.
Methods and procedures
This research used the Tripartite model (Daniel and Harland 2017), illustrated in Fig. 1, to guide the systematic literature review. The Tripartite model draws from systematic review approaches such as the Cochrane, widely used in the analyses of rigorous studies, to provide the best evidence. Moreover, the Tripartite model offers a comprehensive view and presentation of the reports. The model composes of three fundamental components; descriptive (providing a summary of the literature), synthesis (logically categorising the research based on related ideas, connections and rationales), and critique (criticising the novel, providing evidence to support, discard or offer new ideas about the literature). Each of these phases is detailed fully in the following sections.
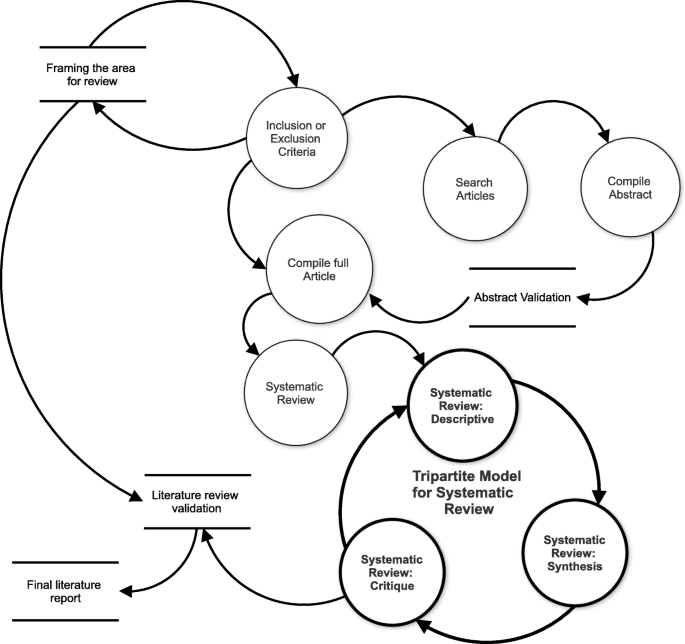
Tripartite Model. The Tripartite Model: A Systematic Literature Review Process (Daniel and Harland 2017)
To provide clarity; the review first focused on describing how TA is conceptualised and utilised. Followed by the synthesis of the literature on the various tools used to harvest, analyse and present teaching-related data to the teachers. Then the critique of the research which led to the development of a conceptual framework describing various aspects of TA. Finally, this paper proposes a Teaching Outcome Model (TOM). TOM is intended to offer teachers help on how to engage and reflect on teaching data.
TOM is a TA life cycle which starts with the data collection stage; where the focus is on teaching data. Then the data analysis stage; the application of different Machine Learning (ML) techniques to the data to discover hidden patterns. Subsequently, the data visualisation stage, where data presentation is carried out in the form of a Teaching Analytics Dashboard (TAD) for the teacher. This phase is where the insight generation, critical thinking and teacher reflection are carried out. Finally, the action phase, this is where actions are implemented by teachers to improve teaching practice. Some of these actions include improving the LD, changing teaching method, providing appropriate feedback and assessment or even carrying out more research. This research aims to inform the future work in the advancement of TA research field.
Framing research area for review
As stated in the introduction, understanding current research on TA can be used to provide teachers with strategies that can help them utilise various forms of data to optimise teaching performance and outcome. Framing the review was guided by some questions and proposed answers to address those questions (see Table 1)
Inclusion and exclusion criteria
The current review started with searching through the Scopus database using the SciVal visualisation and analytical tool. The rationale for choosing the Scopus database is that it contains the largest abstract and citation database of peer-reviewed research literature with diverse titles from publishers worldwide. Hence, it is only conceivable to search for and find a meaningful balance of the published content in the area of TA. Also, the review included peer-reviewed journals and conference proceedings. We excluded other documents and source types, such as book series, books, editorials, trade publications on the understanding that such sources might lack research on TA. Also, this review excluded articles published in other languages other than English.
Search strategy
This review used several keywords and combinations to search on terms related to TA. For instance: ’Teaching Analytics’ AND ’Learning Analytics’ OR ’Teacher Inquiry’ OR ’Data Literacy’ OR ’Learning Design’ OR ’Computer-Supported Collaborative Learning’ OR ’Open Learner Model’ OR ’Visualisation’ OR ’Learning Management System’ OR ’Intelligent Tutoring System’ OR ’Student Evaluation on Teaching’ OR ’Student Ratings’.
This review searched articles published between 2012 to 2019. The initial stage of the literature search yielded 58 papers. After the subsequent screening of previous works and removing duplicates and titles that did not relate to the area of research, 47 articles remained. As such, a total of 36 studies continued for full-text review. Figure 2, shows the process of finalising the previous studies of this review.
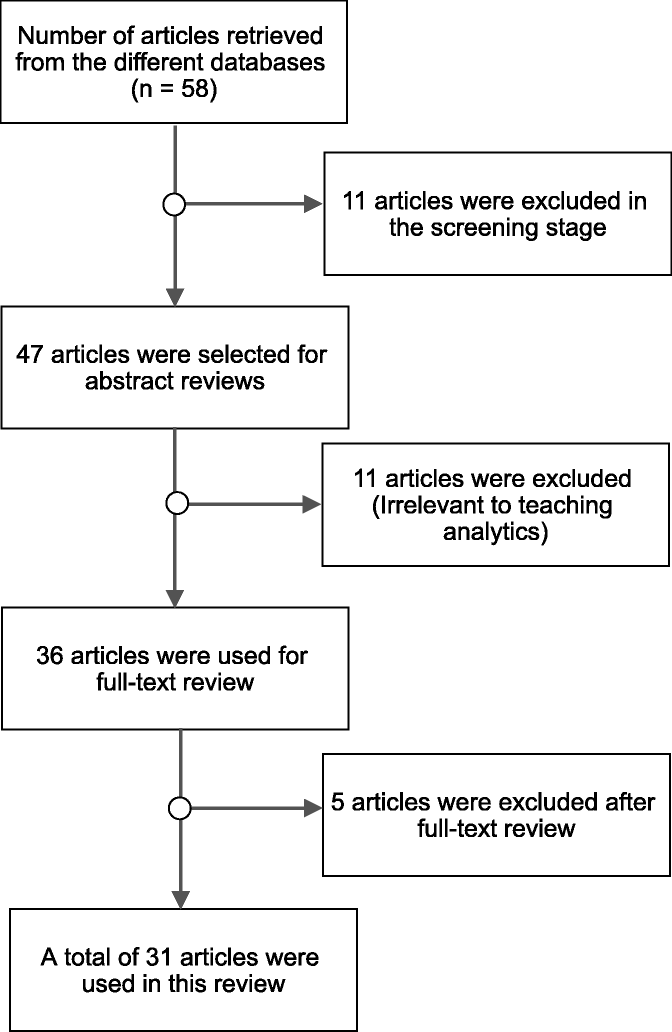
Inclusion Exclusion Criteria Flowchart. The selection of previous studies
Compiling the abstracts and the full articles
The review ensured that the articles identified for review were both empirical and conceptual papers. The relevance of each article was affirmed by requiring that chosen papers contained various vital phrases all through the paper, as well as, title, abstract, keywords and, afterwards, the entire essay. In essence, were reviewed giving particular cognisance and specific consideration to those section(s) that expressly related to the field of TA. In doing as such, to extract essential points of view on definitions, data sources, tools and technologies associated with analytics for the teachers. Also, this review disregarded papers that did not, in any way, relate to analytics in the context of the teachers. Finally, 31 articles sufficed for this review.
Systematic review: descriptive
Several studies have demonstrated that TA is an important area of inquiry (Flanders 1970; Gorham 1988; Pennings et al. 2014; Schempp et al. 2004), that enables researchers to explore analytics associated with teaching process systematically. Such analytics focus on data related to the teachers, students, subjects taught and teaching outcomes. The ultimate goal of TA is to improve professional teaching practice (Huang 2001; Sergis et al. 2017). However, there is no consensus on what constitutes TA. Several studies suggest that TA is an approach used to analyse teaching activities (Barmaki and Hughes 2015; Gauthier 2013; KU et al. 2018; Saar et al. 2017), including how teachers deliver lectures to students, tools usage pattern, or dialogue. While various other studies recognise TA as the ability to applying analytical methods to improve teacher awareness of student activities for appropriate intervention (Ginon et al. 2016; Michos and Hernández Leo 2016; Pantazos et al. 2013; Taniguchi et al. 2017; Vatrapu et al. 2013). A hand full of others indicate TA as analytics that combines both teachers and students activities (Chounta et al. 2016; Pantazos and Vatrapu 2016; Prieto et al. 2016; Suehiro et al. 2017). Hence, it is particularly problematic and challenging to carry out a systematic study in the area of analytics for the teachers to improve teaching practice, since there is no shared understanding of what constitutes analytics and how best to approach TA.
Researchers have used various tools to automatically harvest important episodes of interactive teacher and student behaviour during teaching, for teacher reflection. For instance, KU et al. (2018), utilised instruments such as; Interactive Whiteboard (IWB), Document Camera (DC), and Interactive Response System (IRS) to collect classroom instructional data during instruction. Similarly, Vatrapu et al. (2013) employed eye-tracking tools to capture eye-gaze data on various visual representations. Thomas (2018) also extracted multimodal features from both the speaker and the students’ audio-video data, using digital devices such as cameras and high-definition cameras. Data collected from some of these tools not only provide academics with real-time data but also attract more details about teaching and learning than the teacher may realise. However, the cost of using such digital tools for large-scale verification is high, and cheaper alternatives are sort after. For instance, Suehiro et al. (2017) proposed a novel approach of using e-books to extract teaching activity logs in a face-to-face class efficiently.
Vatrapu (2012) considers TA as a subset of LA dedicated to supporting teachers to understand the learning and teaching process. However, this definition does not recognise that both the learning and teaching processes are intertwined. Also, most of the research in LA collects data about the student learning or behaviour, to provide feedback to the teacher (Vatrapu et al. 2013; Ginon et al. 2016; Goggins et al. 2016; Shen et al. 2018; Suehiro et al. 2017), see, for example, the iKlassroom conceptual proposal by Vatrapu et al. (2013), which highlights a map of the classroom to help contextualise real-time data about the learners in a lecture. Although, a few research draw attention to the analysis of teacher-gathering and teaching practice artefacts, such as lesson plans. Xu and Recker (2012) examined teachers tool usage patterns. Similarly, Gauthier (2013) extracted the analysis of the reasoning behind the expert teacher and used such data to improve the quality of teaching.
Multimodal analytics is an emergent trend used to complement available digital trace with data captured from the physical world (Prieto et al. 2017). Isolated examples include the smart school multimodal dataset conceptual future proposal by Prieto et al. (2017), which features a plan of implementing a smart classroom to help contextualise real-time data about both the teachers and learners in a lecture. Another example, Prieto et al. (2016), explored the automatic extraction of orchestration graphs from a multimodal dataset gathered from only one teacher, classroom space, and a single instructional design. Results showed that ML techniques could achieve reasonable accuracy towards automated characterisation in teaching activities. Furthermore, Prieto et al. (2018) applied more advanced ML techniques to an extended version of the previous dataset to explore the different relationships that exist between datasets captured by multiple sources.
Previous studies have shown that teachers want to address common issues such as improving their TPD and making students learn effectively (Charleer et al. 2013; Dana and Yendol-Hoppey 2019; Pennings et al. 2014). Reflection on teaching practice plays an essential role in helping teachers address these issues during the process of TPD (Saric and Steh 2017; Verbert et al. 2013). More specifically, reflecting on personal teaching practice provides opportunities for teachers to re-examine what they have performed in their classes (Loughran 2002; Mansfield 2019; Osterman and Kottkamp 1993). Which, in turn, helps them gain an in-depth understanding of their teaching practice, and thus improve their TPD. For instance, Gauthier (2013), used a visual teach-aloud method to help teaching practitioners reflect and gain insight into their teaching practices. Similarly, Saar et al. (2017) talked about a self-reflection as a way to improve teaching practice. Lecturers can record and observe their classroom activities, analyse their teaching and make informed decisions about any necessary changes in their teaching method.
The network analysis approach is another promising field of teacher inquiry, especially if combined with systematic, effective qualitative research methods (Goggins et al. 2016). However, researchers and teacher who wish to utilise social network analysis must be specific about what inquiry they want to achieve. Such queries must then be checked and validated against a particular ontology for analytics (Goggins 2012). Goggins et al. (2016), for example, aimed at developing an awareness of the types of analytics that could help teachers in Massive Open Online Courses (MOOCs) participate and collaborate with student groups, through making more informed decisions about which groups need help, and which do not. Network theory offers a particularly useful framework for understanding how individuals and groups respond to each other as they evolve. Study of the Social Network (SNA) is the approach used by researchers to direct analytical studies informed by network theory. SNA has many specific forms, each told by graph theory, probability theory, and algebraic modelling to various degrees. There are gaps in our understanding of the link between analytics and pedagogy. For example, which unique approaches to incorporating research methods for qualitative and network analysis would produce useful information for teachers in MOOCs? A host of previous work suggests a reasonable path to scaling analytics for MOOCs will involve providing helpful TA perspectives (Goggins 2012; Goggins et al. 2016; Vatrapu et al. 2012).
Teacher facilitation is considered a challenging and critical aspect of active learning (Fischer et al. 2014). Both educational researchers and practitioners have paid particular attention to this process, using different data gathering and visualisation methods, such as classroom observation, student feedback, audio and video recordings, or teacher self-reflection. TA enables teachers to perform analytics through visual representations to enhance teachers’ experience (Vatrapu et al. 2011). As in a pedagogical environment, professionals have to monitor several data such as questions, mood, ratings, or progress. Hence, dashboards have become an essential factor in improving and conducting successful teaching. Dashboards are visualisation tools enable teachers to monitor and observe teaching practice to enhance teacher self-reflection (Yigitbasioglu and Velcu 2012). While a TAD is a category of dashboard meant for teachers and holds a unique role and value [62]. First, TAD could allow teachers to access students learning in an almost real-time and scalable manner (Mor et al. 2015), consequently, enabling teachers to improve their self-knowledge by monitoring and observing students activities. TAD assists the teachers in obtaining an overview of the whole classroom as well as drill down into details about individual and groups of students to identify student competencies, strengths and weaknesses. For instance, Pantazos and Vatrapu (2016) described TAD for repertory grid data to enable teachers to conduct systematic visual analytics of classroom learning data for formative assessment purposes. Second, TAD also allows for tracking on teacher self-activities (van Leeuwen et al. 2019), as well as students feedback about their teaching practice. For example,Barmaki and Hughes (2015) explored a TAD that provides automated real-time feedback based on speakers posture, to support teachers practice classroom management and content delivery skills. It is a pedagogical point that dashboards can motivate teachers to reflect on teaching activities, help them improve teaching practice and learning outcome (2016). The literature has extensively described extensively, different teaching dashboards. For instance, Dix and Leavesley (2015), broadly discussed the idea of TAD and how they can represent visual tools for academics to interface with learning analytics and other academic life. Some of these academic lives may include schedules such as when preparing for class or updating materials, or meeting times such as meeting appointments with individual or collective group of students. Similarly, Vatrapu et al. (2013) explored TAD using visual analytics techniques to allow teachers to conduct a joint analysis of students personal constructs and ratings of domain concepts from the repertory grids for formative assessment application.
Systematic review: synthesis
In this second part of the review process, we extracted selected ideas from previous studies. Then group them based on data sources, analytical methods used, types of visualisations performed and actions.
Data sources and tools
Several studies have used custom software and online applications such as employing LMS and MOOCs to collect online classroom activities (Goggins et al. 2016; KU et al. 2018; Libbrecht et al. 2013; Müller et al. 2016; Shen et al. 2018; Suehiro et al. 2017; Vatrapu et al. 2013; Xu and Recker 2012). Others have used modern devices including eye-tracker, portable electroencephalogram (EEG), gyroscope, accelerometer and smartphones (Prieto et al. 2016; Prieto et al. 2018; Saar et al. 2017; Saar et al. 2018; Vatrapu et al. 2013), and conventional instruments such as video and voice recorders (Barmaki and Hughes 2015; Gauthier 2013; Thomas 2018), to record classroom activities. However, some authors have pointed out several issues with modern devices such as expensive equipment, high human resource and ethical concerns (KU et al. 2018; Prieto et al. 2017; Prieto et al. 2016; Suehiro et al. 2017).
In particular, one study by Chounta et al. (2016) recorded classroom activities using humans to code tutor-student dialogue manually. However, they acknowledged that manual coding of lecture activities is complicated and cumbersome. Some authors also subscribe to this school of thought and have attempted to address this issue by applying Artificial Intelligence (AI) techniques to automate and scale the coding process to ensure quality in all platforms (Prieto et al. 2018; Saar et al. 2017; Thomas 2018). Others have proposed re-designing TA process to automate the process of data collection as well as making the teacher autonomous in collecting data about their teaching (Saar et al. 2018; Shen et al. 2018). Including using technology that is easy to set up, effortless to use, does not require much preparation and at the same time, not interrupting the flow of the class. In this way, they would not require researcher assistance or outside human observers. Table 2, summarises the various data sources as well as tools that are used to harvest teaching data with regards to TA.
The collection of evidence from both online and real classroom practice is significant both for educational research and TPD. LA deals mostly with data captured from online and blended learning platforms (e.g., log data, social network and text data). Hence, LA provides teachers with data to monitor and observe students online class activities (e.g., discussion boards, assignment submission, email communications, wiki activities and progress). However, LA neglects to capture physical occurrences of the classroom and do not always address individual teachers’ needs. TA requires more adaptable forms of classroom data collection (e.g., through video- recordings, sensor recording or by human observers) which are tedious, human capital intensive and costly. Other methods have been explored to balance the trade-off between data collected online, and data gathered from physical classroom settings by implementing alternative designs approach (Saar et al. 2018; Suehiro et al. 2017).
Analysis methods
Multimodal analytics is the emergent trend that will complement readily available digital traces, with data captured from the physical world. Several articles in the literature have used multimodal approaches to analyse teaching processes in the physical world (Prieto et al. 2016; Prieto et al. 2017; Prieto et al. 2018; Saar et al. 2017; Thomas 2018). In university settings, unobtrusive computer vision approaches to assess student attention from their facial features, and other behavioural signs have been applied (Thomas 2018). Most of the studies that have ventured into multimodal analytics applied ML algorithms to their captured datasets to build models of the phenomena under investigation (Prieto et al. 2016; Prieto et al. 2018). Apart from research areas that involve multimodal analytics, other areas of TA research have also applied in ML techniques such as teachers tool usage patterns (Xu and Recker 2012), online e-books (Suehiro et al. 2017), students written-notes (Taniguchi et al. 2017). Table 3 outlines some of the ML techniques applied from previous literature in TA.
Visualisation methods
TA allows teachers to apply visual analytics and visualisation techniques to improve TPD. The most commonly used visualisation techniques in TA are statistical graphs such as line charts, bar charts, box plots, or scatter plots. Other visualisation techniques include SNA, spatial, timeline, static and real-time visualisations. An essential visualisation factor for TA is the number of users represented in a visualisation technique. Serving single or individual users allows the analyst to inspect the viewing behaviour of one participant. Visualising multiple or group users at the same time can allow one to find strategies of groups. However, these representations might suffer from visual clutter if too much data displays at the same time. Here, optimisation strategies, such as averaging or bundling of lines might be used, to achieve better results. Table 4 represents the visualisation techniques mostly used in TA.
Systematic review: critique
Student Evaluation on Teaching (SET) data
Although the literature has extensively reported various data sources used for TA, this study also draws attention to student feedback on teaching, as another form of data that originates from the classroom. The analytics of student feedback on teaching could support teacher reflection on teaching practice and add value to TA. Student feedback on teaching is also known as student ratings, or SET is a form of textual data. It can be described as a combination of both quantitative and qualitative data that express students opinions about particular areas of teaching performance. It has existed since the 1920s (Marsh 1987; Remmers and Brandenburg 1927), and used as a form of teacher feedback. In addition to serving as a source of input for academic improvement (Linse 2017), many universities also rely profoundly on SET for hiring, promoting and firing instructors (Boring et al. 2016; Harland and Wald 2018).
Technological advancement has enabled institutions of Higher Education (HE) to administer course evaluations online, forgoing the traditional paper-and-pencil (Adams and Umbach 2012). There has been much research around online teaching evaluations. Asare and Daniel (2017) investigated the factors influencing the rate at which students respond to online SET. While there is a verity of opinions as to the validity of SET as a measure of teaching performance, many teaching academics and administrators perceive that SET is still the primary measure that fills this gap (Ducheva et al. 2013; Marlin Jr and Niss 1980). After all, who experiences teaching more directly than students? These evaluations generally consist of questions addressing the instructor’s teaching, the content and activities of the paper, and the students’ own learning experience, including assessment. However, it appears these schemes gather evaluation data and pass on the raw data to the instructors and administrators, stopping short of deriving value from the data to facilitate improvements in the instruction and the learning experiences. This measure is especially critical as some teachers might have the appropriate data literacy skills to interpret and use such data.
Further, there are countless debates over the validity of SET data (Benton and Cashin 2014; MacNell et al. 2015). These debates have highlighted some shortcomings of student ratings of teaching in light of the quality of instruction rated (Boring 2015; Braga et al. 2014). For Edström, what matters is how the individual teacher perceives an evaluation. It could be sufficient to undermine TPD, especially if the teachers think they are the subjects of audit (Edström 2008). However, SET is today an integral part of the universities evaluation process (Ducheva et al. 2013). Research has also shown that there is substantial room for utilising student ratings for improving teaching practice, including, improving the quality of instruction, learning outcomes, and teaching and learning experience (Linse 2017; Subramanya 2014). This research aligns to the side of the argument that supports using SET for instructional improvements, to the enhancement of teaching experience.
Systematically, analytics of SET could provide valuable insights, which can lead to improving teaching performance. For instance, visualising SET can provide some way, a teacher can benchmark his performance over a while. Also, SET could provide evidence to claim for some level of data fusion in TA, as argued in the conceptualisation subsection of TA.
Transformational TA
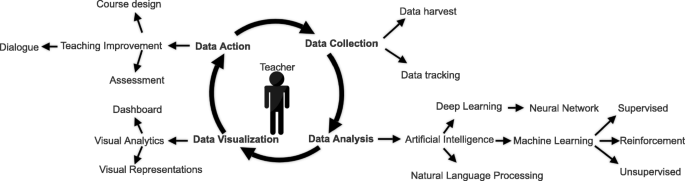
The growing research into big data in education has led to renewed interests in the use of various forms of analytics (Borgman et al. 2008; Butson and Daniel 2017; Choudhury et al. 2002). Analytics seeks to acquire insightful information from hidden patterns and relationships in data that ordinarily would not be visible by the natural eyes, except with the application of state-of-the-art models and methods. Big data analytics in HE provides lenses on students, teachers, administrators, programs, curriculum, procedures, and budgets (Daniel 2015). Figure 3 illustrates the types of analytics that applies to TA to transform HE.

Types of analytics in higher education (Daniel 2019)
Descriptive Analytics Descriptive analytics aims to interpret historical data to understand better organisational changes that have occurred. They are used to answer the "What happened?" information regarding a regulatory process such as what are the failure rates in a particular program (Olson and Lauhoff 2019). It applies simple statistical techniques such as mean, median, mode, standard deviation, variance, and frequency to model past behaviour (Assunção et al. 2015; ur Rehman et al. 2016). Barmaki and Hughes (2015) carried out some descriptive analytics to know the mean view time, mean emotional activation, and area of interest analysis on the data generated from 27 stimulus images to investigate the notational, informational and emotional aspect of TA. Similarly, Michos and Hernández-Leo (2016) demonstrated how descriptive analytics could support teachers’ reflection and re-design their learning scenarios.
Diagnostic Analytics Diagnostic analytics is higher-level analytics that further diagnoses descriptive analytics (Olson and Lauhoff 2019). They are used to answer the "Why it happened?". For example, a teacher may need to carry out diagnostic analytics to know why there is a high failure rate in a particular programme or why students rated a course so low for a specific year compared to the previous year. Diagnostic analytics uses some data mining techniques such as; data discovery, drill-down and correlations to further explore trends, patterns and behaviours (Banerjee et al. 2013). Previous research has applied the repertory grid technique as a pedagogical method to support the teachers perform knowledge diagnostics of students about a specific topic of study (Pantazos and Vatrapu 2016; Vatrapu et al. 2013).
Relational Analytics Relational analytics is the measure of relationships that exists between two or more variables. Correlation analysis is a typical example of relational analytics that measures the linear relationship between two variables (Rayward-Smith 2007). For instance, Thomas (2018) applied correlation analysis to select the best features from the speaker and audience measurements. Some researchers have also referred to other forms of relational analytics, such as co-occurrence analysis to reveal students hidden abstract impressions from students written notes (Taniguchi et al. 2017). Others have used relational analytics to differentiate critical formative assessment futures of an individual student to assist teachers in the understanding of the primary components that affect student performance (Pantazos et al. 2013; Michos and Hernández Leo 2016). A few others have applied it to distinguish elements or term used to express similarities or differences as they relate to their contexts (Vatrapu et al. 2013). Insights generated from this kind of analysis can be considered to help improve teaching in future lectures and also compare different teaching styles. Sequential pattern mining is also another type of relational analytics used to determine the relationship that exists between subsequent events (Romero and Ventura 2010). It can be applied in multimodal analytics to cite the relationship between the physical aspect of the learning and teaching process such as the relationship between ambient factors and learning; or the investigation of robust multimodal indicators of learning, to help in teacher decision-making (Prieto et al. 2017).
Predictive Analytics Predictive analytics aims to predict future outcomes based on historical and current data (Gandomi and Haider 2015). Just as the name infers, predictive analytics attempts to predict future occurrences, patterns and trends under varying conditions (Joseph and Johnson 2013). It makes use of different techniques such as regression analysis, forecasting, pattern matching, predictive modelling and multi-variant statistics (Gandomi and Haider 2015; Waller and Fawcett 2013). In prediction, the goal is to predict students and teachers activities to generate information that can support decision-making by the teacher (Chatti et al. 2013). Predictive analytics is used to answer the "What will happen". For instance, what are the interventions and preventive measures a teacher can take to minimise the failure rate? Herodotou et al. (Herodotou et al. 2019) provided evidence on how predictive analytics can be used by teachers to support active learning. An extensive body of literature suggests that predictive analytics can help teachers improve teaching practice (Barmaki and Hughes 2015; Prieto et al. 2016; Prieto et al. 2018; Suehiro et al. 2017) and also to identify group of students that might need extra support to reach desired learning outcomes (Goggins et al. 2016; Thomas 2018).
Prescriptive Analytics Prescriptive analytics provides recommendations or can automate actions in a feedback loop that might modify, optimise or pre-empt outcomes (Williamson 2016). It is used to answer the "How will it best happen?". For instance, how will teachers make the right interventions for students that have been perceived to be at risk to minimise the student dropout rate or what kinds of resources are needed to support students who might need them to succeed? It determines the optimal action that enhances the business processes by providing the cause-effect relationship and applying techniques such as; graph analysis, recommendation engine, heuristics, neural networks, machine learning and Markov process (Bihani and Patil 2014; ur Rehman et al. 2016). For example, applying curriculum Knowledge graph and learning Path recommendation to support teaching and learners learning process (Shen et al. 2018).
Actionable Analytics Actionable analytics refers to analytics that prompt action (Gudivada et al. 2016; Gudivada et al. 2018; Winkler and Söllner 2018). Norris et al. (2008) used the term action analytics to describe "the emergence of a new generation of tools, solutions, and behaviours that are giving rise to more powerful and effective utilities through which colleges and universities can measure performance and provoke pervasive actions to improve it". The educational sector can leverage some of these innovative, new and cutting edge technologies and techniques such as Natural Language Processing (NLP) (Sergis and Sampson 2016; Taniguchi et al. 2017), big data analytics (Goggins et al. 2016) and deep learning (Prieto et al. 2018) to support teacher in both the teaching and learning processes.
Institutional Transformation Data in themselves are not useful; they only become valuable if they can be used to generate insight. In other words, analytics can be applied to institutional data to optimise productivity and performance of the institutional operations, thereby providing value that can transform the institutional practices. In education, there are various purposes of analytics, ranging from those that provide institutions with an overview or deep-down microscopic view of individual students, faculty, curriculum, programs, operations and budgets, to those capable of predicting future trends. Unveiling the value of TA empowers the teachers to identify issues and transform difficulties into opportunities. These opportunities can be employed to optimises the institutional processes, enhance learner experiences and improve teaching performance. TA and LA both play a vital role in effectively reforming and transforming the educational sector to catch up with the fast pace at which data generates. For example, with the extensive use of online and blended learning platforms, the application of analytics will enable institutional stakeholders at all levels to gain new insights into educational data. Today, the HE sector is at crossroads, where there is a need for synergies in learning research and data analytics to transform the way teaching and learning are fundamentally carried out.
The link between TA, LA and LD
Primarily, TA aims to link the centrepiece of LA and remodel them to address teaching challenges. More specifically, TA argues that connecting and analysing insights generated from LA methods and tools with those generated from in-class methods and tools, through TA tools could support teacher reflection and improve TPD based on evidence. Hence, this concept is presented further in the next subsection.
Conceptual framework of TA
Based on the different perceptions of TA described in previous reviews, this study proposes a conceptual framework for TA to model the complex interaction existing around TA. Three nodes (LA, TA and LD) are interconnected to each other forming a triadic network with the teacher at the centre, performing value-added interactions to make informed based decisions. Each part of this interconnection forms a triangle, totalling three triangles (A, B and C) (see Fig. 4).
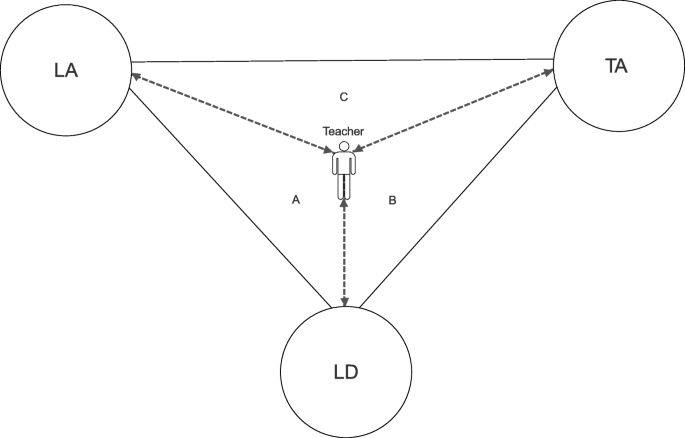
Conceptualisation of TA. Triadic TA Conceptual Framework
The proposed framework is not bound to any particular implementation of learning or design technology. Instead, the point is to describe the elements of analytics and data sources that are key for each domain to guide the use of analytical methods, tools and technology to support the multiple dimensions of learning design successfully.
Triangle A
This triad illustrates the interaction occurring between the teacher, the LA and the LD, to inform TPD. Hernández-Leo et al. (2019) argued that LD could contribute to structuring and orchestrating the design intent with learners digital trace patterns, advancing the knowledge and interpretation of LA. LA tailored to fit the design intent could be considered by teachers as contributing to the enhancement of the LD in subsequent design interactions. For example, LA could be an information tool to inform the tutors or designers of pedagogical decision making (Persico and Pozzi 2015). Hence, a teacher may want to utilise LA to make just-in-time pedagogical decisions, such as grouping students based on their performance.
Similarly, a teacher may want to investigate if the estimated time taken for students to carry out learning tasks is reasonable or whether adjustments need to be made to the course design (Hernández-Leo et al. 2019; Pozzi and Persico 2013). This domain can also provide teachers with analytics regarding the challenges and difficulties students face in the problem-solving phase while performing a task. In return, they give the teacher information in the form of TAD summarising the various challenges students encountered with that activity. They may also provide solutions on how to address them. For example, an early alert system that instantiates a dashboard for instructors using some metrics calculations such as login counts and page views (Thille and Zimmaro 2017). The data sources in the LA node can improve teachers’ awareness, which could also lead to the improvement of LD and help to distinguish design elements that could modify future designs. Data collection in this domain is mostly automatic through virtual learning environments (e.g., LMS, MOOCs). Other forms of data collection may include social media platforms (e.g., Facebook, Tweeter), wearable sensors (e.g., eye-trackers, EEG), software tools that support and collect data related to specific student activities and attendance (Bakharia et al. 2016; Bos and Brand-Gruwel 2016).
Triangle B
This triangle represents the relationship between the teacher, the LD and TA. While experiencing LD, TA endeavours to handle continues teachers’ engagement, progression, achievement and learners satisfaction (Bakharia et al. 2016; Sergis and Sampson 2017). For example, exploring the impact of video shot on instructor performance and student learning. Using MOOC AB testing, teachers could experiment whether a difference in video production setting would have any impact on the instructors acting performance, or whether any changes in format and instructors performance will result in detectable differences in student viewing behaviour (Chen et al. 2016).
Further, data sources in TA could assist teacher reflection on the impacts of their LD. Data collection could also be automatic by the use of wearable sensors on the teachers while performing teaching activities, also known as in-class analytics. Several institutions now record video contents of their face-to-face classes. Some others even go a step further by collecting their physiological data. These datasets, as mentioned earlier, have a way of exemplifying and illustrating things that ordinarily, a book of pedagogy cannot convey, in providing systematic feedback for the teachers. It involves capturing data during a traditional in-class, face-to-face teacher-centric instruction or teacher-student interaction (where students learn by directly or indirectly interacting with instructors in a lab or lecture hall) and analysing data to identify areas of possible improvements. The kind of data usually captured in this setting are audio, video, body movement, brain activity, cortex activity, to mention just a few. For example, a teacher can perform diagnostic analysis on class recorded videos to expose what is intrinsic during his lecture. This kind of diagnostic analysis could help teachers understand more about their teaching and discover areas of further improvement. SET is another form of data about the teachers; they are collected via the institutional application platforms (Hernández-Leo et al. 2019) and can be visualised to improve teaching performance..
Analytics that happens in the LD involves the visualisation of teaching design to facilitate teacher reflection on the lesson plan, visualisation of the extent to which the lesson plan aligns with the educational objectives, and finally, validation of the lesson plan to highlight potential inconsistencies in the teaching design. For example, a teacher can visualise the number of assessment activities of the lesson plan or the various types of educational resources used in the lesson plan, to know if they are still valid or obsolete. Similarly, a teacher could analyse the time allocated for each lesson activity, to find out if the time allocated for each activity is good enough, or visualise the level of inconsistencies of time misappropriations and imbalances between the overall lesson plan and the individual lesson activities.
Triangle C
This area presents the communication between the teacher, the LA and the TA. Chinchu Thomas (2018) explored the correlation between student ratings on teaching and student physiological data. Similarly, Schmidlin (2015) established how to analyse and cross-reference data without decrypting the data sources. Hence, we argue that SET could be linked with LA such as student digital traces from LMS (Stier et al. 2019) and other forms of data (such as attendance data), without compromising privacy. This claim for data fusion could support the teachers to make informed-decisions in new ways. For example, analytics performed on linked datasets could quickly reveal those student opinions that may not count at the end of the semester courses.
Visualisations that could quickly realise students with low participation rates and link it to their opinions, without revealing any identity. Additionally, teachers may be interested in comparing the view of students with low participation rate with those of high participation rate. This kind of information may lead teachers towards making explicit judgements with evidence. A tutor may choose to disregard the opinions of those students that participated less than 20 per cent in-class activities and assignments, as well as had a low attendance rate. Hence, narrowing concentration more on the opinions of students that participated in improving teaching practice.
However, considering ethical concerns, data fusion at the individual level still requires explicit and informed consent from the students whose data are collected (Menchen-Trevino 2016). Other issues such as privacy concerns, data fusion can be problematic as this usually requires that the teachers know student identities. However, from a programmatic perspective, extra measures can be put in place to address this concern. Algorithms can be interfaced to mask student identities to some other unique identities to make them anonymous but linked (Schmidlin et al. 2015) to provide a richer set of data for the teacher to make informed decisions.
Teachers can get a better picture towards improving the context in which learning happens, only if they can be informed about both how they teach and how students learn. Hence, this framework aims to continually provide teachers with interesting information from intelligent feedback based on data generated from users and learning context to improve their learning design and teaching outcome continuously.
Teaching Outcome Model (TOM)
Design-based research advances instructional design work, theory, and implementation as iterative, participatory, and located rather than processes "owned and operated" by designers of instructions (Wang and Hannafin 2005). TOM is an iterative process that follows a design-based research approach to guide teachers, researchers, faculty and administrators on how to utilise data to improve the quality of teaching and learning outcome. This model enables teachers to investigate and evaluate their work using data. Consequently, improving the teacher use of data to inform teaching practice. To build more awareness with regards to teaching data, TOM models TA through iterative cycles of data collection, data analysis, data visualisation and action stages which are interdependent of each other (see Fig. 5). Design-based research, as a pragmatic methodology, can guide TOM while generating insights that can support teacher reflections on teaching and student learning. Conversely, TOM ensures that design-based research methodologies can be operational and systemised. Following the various stages outlined in the model, teachers can regularly identify, match and adjust teaching practice, and learning design to all the learners need.
Teaching Outcome Model. TA Life cycle
Data stage
In the data collection stage, a constant stream of data accumulates from the digital traces relating to teaching daily activities and engagements, including structured and unstructured data, visual and non-visual data, historical and real-time data. It is also important to note that the rate at which diverse data accumulates in our educational system will keep growing. According to Voithofer and Golan (2018), there are several ways to mine teaching and learning data without professional knowledge that is beyond the necessary teacher training experience in data literacy, administering learning design and class orchestration. Subscribing to this school of thought, adopting Big data infrastructure in our institutions will guarantee easy access to data by the various stakeholders, this will also mitigate the bottleneck of disparate data points existing in our educational sector. Therefore, enabling educators to focus more attention on instruction, setting up interactive class activities, and participating more on discussions that will create more data for evidence-based decision making. Also, the misuse of data is a broad primary concern (Roberts et al. 2017). One critical matter is identifying the types of data that can be collected, analysed and visualized; to ensure that the right people have access to the data for the right purpose. As such, implementing data governance policies around institutional data such as; ’open definition of purpose, scope and boundaries, even if that is broad and in some respects, open-ended’ is critical (Kay et al. 2012, p 6). This sort of measure will introduce clarity and address issues around who controls what data as well as security and privacy issues around data.
Analysis stage
This step involves the different ways of working with data to ensure data quality. Professionals such as data scientists, programmers, engineers and researchers need to work together with the teachers at this level. They can apply data mining techniques, statistical methods, complex algorithms, and AI techniques (such as NLP, AI, ML, deep learning) to adequately transform data into the useful analytical process. Analytics in the education space presents in diverse forms including, descriptive, diagnostic, predictive and prescriptive. These different forms of analytics can be utilised to offer a high-level view or fine-grained view of individual learners, teacher, faculty and their various activities, engagements and behaviours. Unravelling the value of data analytics empowers teachers and researchers to identify problems and transform challenges into opportunities that can be utilised to support teacher reflection and enrich teacher data-literacy experiences. For example, teachers can apply NLP on text data to gather topics from discussion posts, contributions participants have made within collaborative projects and their sentiments.
Furthermore, ML techniques could be combined with TA to enhance teaching outcome. For instance, chatbots could support the teacher by acting as a teacher assistant in large classes. An essential consideration in analytics, however, is that data can be easily de-identified (Roberts et al. 2017; Cumbley and Church 2013), especially when data sets increase in size and scope and are combined to generate big data. To resolve these concerns, a particular university introduced a two-stage method of data de-identification coupled with data governance to restrict data access (De Freitas et al. 2015).
Visualisation stage
This stage ensures data presentation in useful and meaningful ways to teachers. Empowering teachers with interactive visual interfaces and dashboards that facilitate teacher cognition and promote reflection about pre-processed and fine-grained teaching and learning activities. Through TAD, can project real-time and historical information from different data sources that might not be necessarily interoperable, and results summarised (Moore 2018). However, visualisation is "what you see is what you get"; meaning that information presentation method may affect its interpretation, and consequently, may influence decision-making. Hence, it is necessary to address issues around visualisations in diverse forms such as; visual analytics and exploratory data analysis to create room for visual interactivity, exploratory visualisation to discover trends, patterns, relationships and behaviours. For example, a teacher can use a TAD to monitor student engagement. When the student engagement is poor, it may prompt the teacher to take necessary actions such as; changing teaching material and making it more interactive. Additionally, there are also questions around privacy, such as who has access to visualisations relevant to an instructor, such as other faculty members participating in the course, directly or indirectly, administrators, researchers, potential employees of other institutions.
Action stage
At this stage, informed-decision leads to action and actions unavoidably reshape our environment; subsequently, regenerate new data. Additionally, there is a to create tools that will be useful to the teacher to understand and make meaning of data quickly. Actions taken by teachers can be used to improve the course design and assessment (value-added formative assessment). In any case, predictive analytics prompts an epistemological question; how should we ensure effective action by the teacher based on flawed predictions such that the system does not collapse?
Discussion and conclusion
This article presents the result of a systematic literature review aimed at describing the conception, and synthesis of the current research on the notion of TA, to provide insight into how TA can be used to improve the quality of teaching. The first part of the article described what is meant by TA to consolidate the divergent discourse on TA. The review showed that TA applies to analytics on teaching activities as well as methods of improving teachers’ awareness on students’ activities, including supporting the teachers to understand student learning behaviours to provide adequate feedback to teachers. In essence, the primary goal of TA is to improve teaching performance. The literature also revealed the several tools and methods are available for extracting digital traces associated with teaching in addition to traditional student evaluation tools. However, one of the main challenges recognised was the cost associated with some devices used to capture in-class activities, and ML techniques have been proposed to minimise this challenge.
The literature has also recognised teacher inquiry as a promising area of research in TA and came to a consensus that methods, like multimodal analytics and SNA, could help promote teacher inquiry and teacher reflection. Visualisations and visual analytics techniques are very significant in TA and also encourage teacher inquiry. The use of visualisation dashboards and TAD are essential tools that the modern-day teachers require to carry out a continuous and efficient reflection on teaching practice.
The emphasis of the synthesis of TA was clearly on data collection, analysis and visualisation, as illustrated in Fig. 6. In the literature, the various kinds of data collected and used to improve teaching practice, include:
Digital trace data; "records of activity (trace data) undertaken through an online information system (thus, digital)" [119]. They incorporate various activities generated from custom applications and learning environments that leave digital footprints.
Image data are photographic or trace objects that represent the underlying pixel data of an area of an image element.
Physiological data are body measurement based on body-mounted sensors (Lazar et al. 2017), used to extract data from teachers while performing classroom teaching activities.
Audio-video stream data or recorded lecturer data with captured physical teaching activities and students learning activities. Hence, attainable with mounted cameras, computer or mobile cameras connected to applications like Zoom and Skype, eye tracks with recording capabilities and digital cameras connected to learning environments such as Eco365.
Social data are data with online social activities, including utilising the repertory grid technique to collect students’ assessment data from social media sites.
Text data, including quantitative and qualitative data, data generated from text documents such as discussion forums, students essay or articles, emails and chat messages.

Dimensions of TA. Illustration of TA based on the literature
Analysis in this context refers to the application of Educational Data Mining (EDM) and deep learning techniques mostly used to process data. EDM approaches is a complicated process that requires an interweaving of various specialised knowledge and ML algorithms, especially to improve teaching and learning (Chen 2019). NLP and classification are the two main EDM techniques applied in TA. However, the review also recognised the use of other methods such as clustering and deep learning techniques, to support teachers.
As commonly said, a picture is worth more than a thousand words; visualisation can effectively communicate and reveal structures, patterns and trends in variables and their interconnections. Research in TA has applied several visualisation techniques including Network, Timeline, Spatial, Table and Statistical Graphs. For instance, SNA is a form of visual analytics that is used to support teachers to determine how different groups interact and engage with course resources. Identifying differences in interaction patterns for different groups of students may result in different learning outcomes, such as, how access patterns of successful groups of students differ from that of unsuccessful students. Applying visualisation techniques can support teachers in areas such as advising underperforming students about effective ways to approach study. Visualisation can enable teachers to identify groups of students that might need assistance and discover new and efficient means of using collaborative systems to achieve group work that can be taught explicitly to students.
However, while acknowledging the incomplete nature of data and complexities associated with data collection, analysis and use, teachers should take caution to avoid bais. Data collected in one context may not be directly applicable to another or have both benefits and cost for individuals or groups from which data was harvested. Therefore, key stakeholders, including teachers, course directors, unit coordinators and researchers must pay proper attention to predictive models and algorithms and take extra care to ensure that the contexts of data analysed are carefully considered. There are also privacy concerns, such as who has access to view analytics relating to a teacher, including other faculty members both directly or indirectly involved in the course, administrators, researchers, future employees of other institutions. It will be useful for institutions to have clear guidelines as to who has access to what and who views what. Other issues around data include how long should data remain accessible (Siemens 2013), with big data technology and infrastructure, data should be kept for as long as it can exist. Pardo and Siemens (2014) acknowledged that the use of analytics in higher education research has no clear interpretation of the right to privacy. They seem opposed to the need for absolute privacy, on the basis that the use of historical data enhances research with potential rewards for the future of teaching professional development and student outcome.
The review provided in the current article highlighted the significant limitations in the existing literature on teaching analytics. The TAD is proposed to guide teachers, developers, and researchers to understand and optimise teaching and the learning environments. The critical aspect of this review is establishing the link between LA, TA and LD and its value in informing teachers’ inquiry process. Also, the review describes the relationship between LA, TA and LD. Finally, the article proposes TOM, which draws from a research-based approach to guide teachers on how to utilise data to improve teaching. The outcome of this model is a TAD that provides actionable insights for teacher reflection and informed decision-making. Therefore, showing the value that TA brings to pedagogic interventions and teacher reflection.
Theoretical implications
The analysis of data collected from the interaction of teachers with technology and students is a promising approach for advancing our understanding of the teaching process and how it can be supported. Teachers can use data obtained from their teaching to reflect on their pedagogical design and optimise the learning environment to meet students’ diverse needs and expectations.
Teacher-centric learning design can improve the utility of new technologies and subsequent acceptance of the use of these technologies to improve the quality of teaching and enhance students learning experience. TAD is one class of tools that can be designed in such a way that will improve teaching practice.
Research on learning analytics has revealed useful insights about students’ learning and the context in which they learn. While the ability to track, harvest and analyse various forms of learning analytics can reveal useful insights about learners’ engagement with learning environments, our review suggests that there is limited focus on analytics relating to the teacher, their teaching approaches and activities. Also, there has been increasing advances in the design of learner and teaching dashboards. However, many teachers still struggle with understanding and interpreting dashboards partly because they lack data literacy skills, and mostly because most the design of many of the tools does not include teachers as partners.
Although, TAD enable teachers to inspect, and understand the processes and progress relating to their teaching, the current implementations of TAD in general, does not adequately provide teachers with the details they need or want in a readily usable format. Educational technology developers can utilise our proposed model to design better tools for improving teaching practice. For example, a TAD can be designed to perform text analytics on students qualitative comments about a course taught, and results presented to the teacher in the form of themes, sentiments and classification; such that it will support the instructor’s needs and preferences for insight generation and reflection.
Teachers monitor, observe and track both teaching and learning activities to make appropriate decisions. Moreover, it is also important to note that visualisations can be misrepresented, misinterpreted or misused by the viewer [122]. Hence, perception and cognition remain a significant challenge in TAD. Consequently, it becomes necessary to design and write algorithms that extract information visualisation, in such a way that allows adequate understanding by teachers. It is also crucial for dashboards to integrate multiple sources such as combining both the learning and teaching activities into a TAD, to create room for teachers to comprehend, reflect on and act upon the presented information quickly.
Also, the current state of technology shows little progress in taking TA, raising concerns about the accurate validity and scalability of innovations such as predictive analytics and TAD. Furthermore, the ethical issues of data use are not considered sufficient to establish institutional policies which incorporate TA as part of quality education models.
Finally, consideration of the framework’s three layers as a whole raises new questions and opportunities. For example, linking educational performance and satisfaction to specific learning design involves consideration of elements of all three layers. This review has shown that TA is a new and essential area of analytics in education. The study also suggests that the conceptualisation of teaching analytics is still at its infancy. However, the practical and successful use of teaching analytics is highly dependent on the development of conceptual and theoretical foundations into consideration.
Implications for practice
This review has uncovered the value of TA and its role in fostering data literacy skills in teachers to support evidence-based teaching. The purpose of TOM is to guide the development of teaching dashboard, and for researchers to develop strategies that help meaningful ways in which data can be presented to teachers. Teacher dashboards can empower the teachers with tools that create new opportunities to make data-informed strategic decisions, utilising the power of analytics and visualisation techniques. Consequently, increasing the efficiency and effectiveness of the institution, including, improving teaching practice, curriculum development and improvement, active learning engagement and improved students’ success. TOM also presents a platform for teaching academics who may have the best understanding of their course contexts, to provide a significant contribution to a culture of data-informed teaching practice within an institution.
The responsibility for managing the systems that provide the analytics usually falls within the control and supervision of the institution’s information technology (IT) department, and often, they have little to no knowledge of their pedagogical applications to teaching and learning. Likewise, academics and their fields of learning support are often deprived of IT skills and have little to no professional understanding of how software systems work. TOM provides opportunities for the teachers to be involved in the design of TA by providing significant interaction and collaboration between the IT and the other sectors that interpret and act upon the information flow.
Additionally, institutions need to provide teaching staff with the necessary training that fosters the development of data literacy skills, and in the use of data and analytical or visualisation dashboards to monitor their teaching practice. Based on some of the challenges identified in the present review, it is imperative institutions ensure that data is collected transparently, with the awareness of all the stakeholders involved, and informed consent of individuals where appropriate. With the advancements in computing technology, data collection, analysis and use have significantly increased, large amounts of data can be continually pulled from different sources and processed at fast speeds. Big data offers institutions the opportunity to implement big data infrastructures and utilise the full potential of data analytics and visualisation. However, institutions also need to consider implementing a data governance framework to guide the implementation and practice of analytics.
The conceptual framework of TA was established to demonstrate the relationship between LA, TA and LD, which can be useful knowledge to various institutional stakeholders, including the learners, teachers, researchers and administrators. However, there are also issues around data ownership, intellectual property rights, and licensing for data re-use (the students, the instructor, the researcher or the institution). For instance, the same data sources can be shared amongst the various stakeholders, but with different level of access, as such data sharing agreement would be needed to guide sharability without infringing on rights, violating privacy or disadvantaging individuals. The implementation of data sharing agreement would require the building of institutional, group as well as individual trust, which would include guidelines on sharing data within the institution and between third parties, such as external organisations and other institutions. In general, stricter data management policies that guide data collection, analysis and use is essential for every institution.
Limitations and future research
Teaching analytics is an emergent phenomenon in the learning analytics and data science literature, with a limited body of published work in the area, as such conclusions drawn from the review are limited to the databases interrogated and articles reviewed. Further, findings in the review are likely to be influenced by our interpretation of the literature and untestable assumptions. For example, linking LA, TA and LD and their underlying assumptions is not grounded in empirical work. The review serves as an advocacy for teacher data literacy and the ability to work with various forms of data. However, working with a single data point may not be publicly accessible to teachers.
Moreover, the combination of analytics on the several data points may lead to some level of identification, and this would require navigating issues around access, protecting privacy, and obtaining appropriate consents. Therefore, it is almost impossible for individual teachers to comprehend not only the scope of data collected, analysed and used but also the consequences of the different layers of collection, analysis and use. Consequently, making it challenging for teachers to make use of the full potentials of data to make informed choices in learning design. No matter how straightforward or transparent institutional policies around data are, the sheer complexity of the collection, analysis and use has made it impossible, posing a fundamental issue for the stakeholders trying to use analytics to enhance teaching practice and learning outcome across an institution.
In future research, we hope to carry out more extensive empirical research on how TOM could be applied to address issues with regards to ethical and privacy concerns about the utilization of TA. We are currently exploring how teaching analytics dashboards can be used to support teacher data literacy and use analytics to improve teaching practice and learning outcome.
Availability of data and materials
Not applicable.
Abbreviations
- AA:
-
Academic analytics
- AI:
-
Artificial intelligence
- EDM:
-
Educational data mining
- HE:
-
Higher education
- IWB:
-
Interactive whiteboard
- LA:
-
Learning analytics
- LD:
-
Learning design
- LMS:
-
Learning management system
- ML:
-
Machine learning
- MOOCs:
-
Massive open online courses
- NLP:
-
Natural language processing
- OLM:
-
Open learners model
- SET:
-
Student evaluation of teaching
- SNA:
-
Social network analysis
- TA:
-
Teaching analytics
- TAD:
-
Teaching analytics dashboard
- TFIDF:
-
Term frequency inverse document frequency
- TLA:
-
Teaching and learning analytics
- TOM:
-
Teaching outcome model
- TPACK:
-
Technology, pedagogy, and content knowledge
- TPD:
-
Teacher professional development
References
Adams, M.J., & Umbach, P.D. (2012). Nonresponse and online student evaluations of teaching: Understanding the influence of salience, fatigue, and academic environments. Research in Higher Education, 53(5), 576–591.
Anderson, T. (2003). Getting the mix right again: An updated and theoretical rationale for interaction. The International Review of Research in Open Distributed Learning, 4(2).
Asare, S., & Daniel, B.K. (2017). Factors influencing response rates in online student evaluation systems: A systematic review approach. In E-Learn: World Conference on E-Learning in Corporate, Government, Healthcare, and Higher Education. Association for the Advancement of Computing in Education (AACE), (pp. 537–541).
Assunção, M.D., Calheiros, R.N., Bianchi, S., Netto, M.A., Buyya, R. (2015). Big data computing and clouds: Trends and future directions. Journal of Parallel and Distributed Computing, 79, 3–15.
Bakharia, A., Corrin, L., De Barba, P., Kennedy, G., Gašević, D., Mulder, R., Williams, D., Dawson, S., Lockyer, L. (2016). A conceptual framework linking learning design with learning analytics. In Proceedings of the Sixth International Conference on Learning Analytics & Knowledge. ACM, (pp. 329–338).
Banerjee, A., Bandyopadhyay, T., Acharya, P. (2013). Data analytics: Hyped up aspirations or true potential?Vikalpa, 38(4), 1–12.
Barmaki, R., & Hughes, C.E. (2015). Providing real-time feedback for student teachers in a virtual rehearsal environment. In Proceedings of the 2015 ACM on International Conference on Multimodal Interaction. ACM, (pp. 531–537).
Beer, C., Jones, D., Clark, K. (2009). The indicators project identifying effective learning: Adoption, activity, grades and external factors. In Ascilite. Citeseer.
Benton, S.L., & Cashin, W.E. (2014). Student ratings of instruction in college and university courses, (pp. 279–326): Springer.
Bihani, P., & Patil, S. (2014). A comparative study of data analysis techniques. International Journal of Emerging Trends & Technology in Computer Science, 3(2), 95–101.
Borgman, C.L., Abelson, H., Dirks, L., Johnson, R., Koedinger, K.R., Linn, M.C., Lynch, C.A., Oblinger, D.G., Pea, R.D., Salen, K. (2008). Fostering learning in the networked world: The cyberlearning opportunity and challenge. a 21st century agenda for the national science foundation. https://doi.org/10.1037/e532532011-001.
Boring, A. (2015). Gender biases in student evaluation of teachers. Paris. https://doi.org/10.1016/j.jpubeco.2016.11.006.
Boring, A., Ottoboni, K., Stark, P.B. (2016). Student evaluations of teaching are not only unreliable, they are significantly biased against female instructors. Impact of Social Sciences Blog. The London School of Economics and Political Science.
Bos, N., & Brand-Gruwel, S. (2016). Student differences in regulation strategies and their use of learning resources: implications for educational design. In Proceedings of the Sixth International Conference on Learning Analytics & Knowledge. ACM, (pp. 344–353).
Braga, M., Paccagnella, M., Pellizzari, M. (2014). Evaluating students’ evaluations of professors. Economics of Education Review, 41, 71–88.
Butson, R., & Daniel, B. (2017). The Rise of Big Data and Analytics in Higher Education, (pp. 127–140): Auerbach Publications.
Charleer, S., Klerkx, J., Odriozola, S., Luis, J., Duval, E. (2013). Improving awareness and reflection through collaborative, interctive visualizations of badges. In ARTEL13: Proceedings of the 3rd Workshop on Awareness and Reflection in Technology-enhanced Learning, vol. 1103. CEUR Workshop Proceedings, (pp. 69–81).
Chatti, M.A., Dyckhoff, A.L., Schroeder, U., Thüs, H. (2013). A reference model for learning analytics. 5-6, 4, 318–331.
Chen, L.-L. (2019). Enhancing teaching with effective data mining protocols. Journal of Educational Technology Systems, 47(4), 500–512.
Chen, Z., Chudzicki, C., Palumbo, D., Alexandron, G., Choi, Y.-J., Zhou, Q., Pritchard, D.E. (2016). Researching for better instructional methods using ab experiments in moocs: results and challenges. Research and Practice in Technology Enhanced Learning, 11(1), 9.
Choudhury, S., Hobbs, B., Lorie, M., Flores, N. (2002). A framework for evaluating digital library services. D-Lib magazine, 8(7/8), 1082–9873.
Chounta, I.-A., McLaren, B.M., Albacete, P.L., Jordan, P.W., Katz, S. (2016). Analysis of human-to-human tutorial dialogues: Insights for teaching analytics. In IWTA@ EC-TEL, (pp. 9–17).
Cumbley, R., & Church, P. (2013). Is “big data” creepy?Computer Law & Security Review, 29(5), 601–609.
Dana, N.F., & Yendol-Hoppey, D. (2019). The Reflective Educator’s Guide to Classroom Research: Learning to Teach and Teaching to Learn Through Practitioner Inquiry: Corwin.
Daniel, B. (2015). Big data and analytics in higher education: Opportunities and challenges. British Journal of Educational Technology, 46(5), 904–920. https://doi.org/10.1111/bjet.12230.
Daniel, B., & Harland, T. (2017). Higher Education Research Methodology: A Step-by-Step Guide to the Research Process. Routledge London. https://doi.org/10.4324/9781315149783.
Daniel, B.K. (2019). Artificial reality: The practice of analytics and big data in educational research. In: Pedersen, J.S., & Wilkinson, A. (Eds.) In Big data: Promise, application and pitfalls. https://doi.org/10.4337/9781788112352.00018. Edward Elgar, Cheltenham, (pp. 287–300).
De Freitas, S., Gibson, D., Du Plessis, C., Halloran, P., Williams, E., Ambrose, M., Dunwell, I., Arnab, S. (2015). Foundations of dynamic learning analytics: Using university student data to increase retention. British Journal of Educational Technology, 46(6), 1175–1188.
Dix, A.J., & Leavesley, J. (2015). Learning analytics for the academic: An action perspective. J. UCS, 21(1), 48–65.
Ducheva, Z., Pehlivanova, M., Dineva, S. (2013). Possibilities for students to evaluate and improve electronic courses. In The 8th International Conferemnce on Virtual Learning ICVL.
Edström, K. (2008). Doing course evaluation as if learning matters most. Higher Education Research & Development, 27(2), 95–106.
Elias, T. (2011). Learning analytics. Learning, 1–22.
Ferguson, R. (2012). Learning analytics: drivers, developments and challenges. International Journal of Technology Enhanced Learning, 4(5/6), 304–317.
Fischer, F., Wild, F., Sutherland, R., Zirn, L. (2014). Grand Challenge Problems from the Alpine Rendez-Vous, (pp. 3–71): Springer.
Flanders, N.A. (1970). Analyzing Teacher Behavior. Addison-Wesley P.C.
Flavin, M. (2017). Disruptive Technology Enhanced Learning: The Use and Misuse of Digital Technologies in Higher Education: Springer. https://doi.org/10.1057/978-1-137-57284-4.
Gandomi, A., & Haider, M. (2015). Beyond the hype: Big data concepts, methods, and analytics. International Journal of Information Management, 35(2), 137–144.
Gauthier, G. (2013). Using teaching analytics to inform assessment practices in technology mediated problem solving tasks. In IWTA@ LAK.
Ginon, B., Johnson, M.D., Turker, A., Kickmeier-Rust, M. (2016). Helping Teachers to Help Students by Using an Open Learner Model. https://doi.org/10.1007/978-3-319-45153-4_69.
Goggins, S.P. (2012). Group informatics: A multi-domain perspective on the development of teaching analytics. In Proceedings of the TaPTA Workshop at EC-TEL.
Goggins, S.P., Galyen, K., Petakovic, E., Laffey, J.M. (2016). Connecting performance to social structure and pedagogy as a pathway to scaling learning analytics in moocs: an exploratory study. Journal of Computer Assisted Learning, 32(3), 244–266.
Gorham, J. (1988). The relationship between verbal teacher immediacy behaviors and student learning. Communication Education, 37(1), 40–53.
Griffiths, D. (2017). The use of models in learning design and learning analytics. Interaction Design and Architecture(s) Journal, 33, 113–133.
Gudivada, V.N., Irfan, M., Fathi, E., Rao, D. (2016). Cognitive analytics: Going beyond big data analytics and machine learning (Vol. 35, pp. 169–205).
Gudivada, V.N., Rao, D.L., Ding, J. (2018). 2. Evolution and Facets of Data Analytics for Educational Data Mining and Learning Analytics, (pp. 16–42). New York. https://doi.org/10.4324/9780203728703-3.
Harland, T., & Wald, N. (2018). Vanilla teaching as a rational choice: the impact of research and compliance on teacher development. Teaching in Higher Education, 23(4), 419–434.
Hernández-Leo, D., Martinez-Maldonado, R., Pardo, A., Muñoz-Cristóbal, J.A., Rodríguez-Triana, M.J. (2019). Analytics for learning design: A layered framework and tools. British Journal of Educational Technology, 50(1), 139–152.
Herodotou, C., Hlosta, M., Boroowa, A., Rienties, B., Zdrahal, Z., Mangafa, C. (2019). Empowering online teachers through predictive learning analytics. British Journal of Educational Technology. https://doi.org/10.1111/bjet.12853.
Huang, C.-W. (2001). Educlick: A computer-supported formative evaluation system with wireless devices in ordinary classroom. In Proceedings of Int. Conference on Computers in Education, 2010, (pp. 1462–1469).
Joseph, R.C., & Johnson, N.A. (2013). Big data and transformational government. IT Professional, 15(6), 43–48.
Kaser, L., & Halbert, J. (2014). Creating and sustaining inquiry spaces for teacher learning and system transformation. European Journal of Education, 49(2), 206–217.
Kay, D., Korn, N., Oppenheim, C. (2012). Legal, risk and ethical aspects of analytics in higher education. Analytics Series. JISC Cetis (Centre for educational technology and interoperability standards).
KU, O., LIANG, J.-K., CHANG, S.-B., WU, M. (2018). Sokrates teaching analytics system (stas): An automatic teaching behavior analysis system for facilitating teacher professional development. In Proceedings of the 26th International Conference on Computers in Education. Philippines: Asia-Pacific Society for Computers in Education.
Laney, D. (2001). 3d data management: Controlling data volume, velocity and variety. META Group Research Note. META group research note, 6(70), 1.
Lazar, J., Feng, J.H., Hochheiser, H. (2017). Research Methods in Human-computer Interaction: Morgan Kaufmann.
Leitner, P., Khalil, M., Ebner, M. (2017). Learning analytics in higher education—a literature review, (pp. 1–23): Springer.
Libbrecht, P., Kortenkamp, U., Rebholz, S., Müller, W. (2013). Tales of a companion teacher analytics. In IWTA@ LAK.
Linse, A.R. (2017). Interpreting and using student ratings data: Guidance for faculty serving as administrators and on evaluation committees. Studies in Educational Evaluation, 54, 94–106.
Loughran, J.J. (2002). Effective reflective practice: In search of meaning in learning about teaching. Journal of teacher education, 53(1), 33–43.
Macfadyen, L.P., & Dawson, S. (2012). Numbers are not enough. why e-learning analytics failed to inform an institutional strategic plan. Journal of Educational Technology Society, 15(3).
MacNell, L., Driscoll, A., Hunt, A.N. (2015). What’s in a name: Exposing gender bias in student ratings of teaching. Innovative Higher Education, 40(4), 291–303.
Mansfield, J. (2019). Pedagogical Equilibrium: The Development of Teachers’ Professional Knowledge: Routledge.
Marlin Jr, J.W., & Niss, J.F. (1980). End-of-course evaluations as indicators of student learning and instructor effectiveness. The Journal of Economic Education, 11(2), 16–27.
Marsh, H.W. (1987). Students’ evaluations of university teaching: Research findings, methodological issues, and directions for future research. International Journal of Educational Research, 11(3), 253–388.
McKenney, S., & Mor, Y. (2015). Supporting teachers in data–informed educational design. British journal of educational technology, 46(2), 265–279.
Menchen-Trevino, E. (2016). Web historian: Enabling multi-method and independent research with real-world web browsing history data. In IConference 2016 Proceedings. https://doi.org/10.9776/16611.
Michos, K., & Hernández Leo, D. (2016). Towards understanding the potential of teaching analytics within educational communities. In: Vatrapu, R.G.B.B.S., & Kickmeier-Rust, M. (Eds.) In Vatrapu R, Kickmeier-Rust M, Ginon B, Bull S. IWTA 2016 International Workshop on Teaching Analytics. Proceedings of the Fourth International Workshop on Teaching Analytics, in Conjunction with EC-TEL 2016; 2016 Sept 16; Lyon, France.[place Unknown]: CEUR Workshop Proceedings, (pp. 1–8).
Moore, B.L. (2018). 6. The Role of Data Analytics in Education Possibilities and Limitations, 1st edn.https://doi.org/10.4324/9780203728703-8.
Mor, Y., Ferguson, R., Wasson, B. (2015). Learning design, teacher inquiry into student learning and learning analytics: A call for action. British Journal of Educational Technology, 46(2), 221–229.
Müller, W., Rebholz, S., Libbrecht, P. (2016). Automatic inspection of e-portfolios for improving formative and summative assessment. In International Symposium on Emerging Technologies for Education. Springer, (pp. 480–489).
Norris, D., Baer, L., Leonard, J., Pugliese, L., Lefrere, P. (2008). Action analytics: Measuring and improving performance that matters in higher education. EDUCAUSE Review, 43(1), 42.
Olson, D.L., & Lauhoff, G. (2019). Descriptive data mining, (pp. 129–130): Springer.
Osterman, K.F., & Kottkamp, R.B. (1993). Reflective Practice for Educators: Improving Schooling Through Professional Development: ERIC.
Pantazos, K., & Vatrapu, R. (2016). Enhancing the professional vision of teachers: A physiological study of teaching analytics dashboards of students’ repertory grid exercises in business education. In System Sciences (HICSS), 2016 49th Hawaii International Conference On. IEEE, (pp. 41–50).
Pantazos, K., Vatrapu, R.K., Hussain, A. (2013). Visualizing repertory grid data for formative assessment. In IWTA@ LAK.
Papamitsiou, Z., & Economides, A.A. (2016). Learning analytics for smart learning environments: A meta-analysis of empirical research results from 2009 to 2015. Learning, Design, and Technology: An International Compendium of Theory, Research, Practice, and Policy, 1–23. https://doi.org/10.1007/978-3-319-17727-4_15-1.
Pardo, A., & Siemens, G. (2014). Ethical and privacy principles for learning analytics. British Journal of Educational Technology, 45(3), 438–450.
Pascual-Miguel, F., Chaparro-Pelaez, J., Hernandez-Garcia, A., Iglesias-Pradas, S. (2011). A characterisation of passive and active interactions and their influence on students’ achievement using moodle lms logs. International Journal of Technology Enhanced Learning, 3(4), 403–414.
Pennings, H.J., Brekelmans, M., Wubbels, T., van der Want, A.C., Claessens, L.C., van Tartwijk, J. (2014). A nonlinear dynamical systems approach to real-time teacher behavior: Differences between teachers. Nonlinear Dynamics, Psychology, and Life Sciences, 18(1), 23–45.
Persico, D., & Pozzi, F. (2015). Informing learning design with learning analytics to improve teacher inquiry. British Journal of Educational Technology, 46(2), 230–248.
Pozzi, F., & Persico, D. (2013). Sustaining learning design and pedagogical planning in cscl. Research in Learning Technology, 21. https://doi.org/10.3402/rlt.v21i0.17585.
Prieto, L.P., Magnuson, P., Dillenbourg, P., Saar, M. (2017). Reflection for action: Designing tools to support teacher reflection on everyday evidence. https://doi.org/10.31219/osf.io/bj2rp.
Prieto, L.P., Rodriguez-Triana, M.J., Kusmin, M., Laanpere, M. (2017). Smart school multimodal dataset and challenges. In Joint Proceedings of the Sixth Multimodal Learning Analytics (MMLA) Workshop and the Second Cross-LAK Workshop Co-located with 7th International Learning Analytics and Knowledge Conference, vol. 1828. CEUR, (pp. 53–59).
Prieto, L.P., Sharma, K., Dillenbourg, P., Jesús, M. (2016). Teaching analytics: towards automatic extraction of orchestration graphs using wearable sensors. In Proceedings of the Sixth International Conference on Learning Analytics & Knowledge. ACM, (pp. 148–157).
Prieto, L.P., Sharma, K., Kidzinski, Ł., Rodríguez-Triana, M.J., Dillenbourg, P. (2018). Multimodal teaching analytics: Automated extraction of orchestration graphs from wearable sensor data. Journal of Computer Assisted Learning, 34(2), 193–203.
Ramos, C., & Yudko, E. (2008). "hits"(not "discussion posts") predict student success in online courses: a double cross-validation study. Computers & Education, 50(4), 1174–1182.
Rayward-Smith, V.J. (2007). Statistics to measure correlation for data mining applications. Computational Statistics & Data Analysis, 51(8), 3968–3982.
Remmers, H.H., & Brandenburg, G. (1927). Experimental data on the purdue rating scale for instructors. Educational Administration and Supervision, 13(6), 399–406.
Rienties, B., Boroowa, A., Cross, S., Farrington-Flint, L., Herodotou, C., Prescott, L., Mayles, K., Olney, T., Toetenel, L., Woodthorpe, J. (2016). Reviewing three case-studies of learning analytics interventions at the open university uk. In Proceedings of the Sixth International Conference on Learning Analytics & Knowledge. ACM, (pp. 534–535).
Roberts, L.D., Chang, V., Gibson, D. (2017). Ethical considerations in adopting a university-and system-wide approach to data and learning analytics, (pp. 89–108): Springer. https://doi.org/10.1007/978-3-319-06520-5_7.
Romero, C., & Ventura, S. (2010). Educational data mining: a review of the state of the art. IEEE Transactions on Systems, Man, and Cybernetics, Part C (Applications and Reviews), 40(6), 601–618.
Saar, M., Kusmin, M., Laanpere, M., Prieto, L.P., Rüütmann, T. (2017). Work in progress–semantic annotations and teaching analytics on lecture videos in engineering education. In Global Engineering Education Conference (EDUCON), 2017 IEEE. IEEE, (pp. 1548–1551).
Saar, M., Prieto, L.P., Rodríguez-Triana, M.J., Kusmin, M. (2018). Personalized, teacher-driven in-action data collection: technology design principles. In 2018 IEEE 18th International Conference on Advanced Learning Technologies (ICALT). IEEE, (pp. 58–62).
Saric, M., & Steh, B. (2017). Critical reflection in the professional development of teachers: Challenges and possibilities. CEPS Journal, 7(3), 67–85.
Saye, J.W., & Brush, T. (2007). Using technology-enhanced learning environments to support problem-based historical inquiry in secondary school classrooms. Theory Research in Social Education, 35(2), 196–230.
Schempp, P., McCullick, B., Pierre, P.S., Woorons, S., You, J., Clark, B. (2004). Expert golf instructors’ student-teacher interaction patterns. Research Quarterly for Exercise and Sport, 75(1), 60–70.
Schmidlin, K., Clough-Gorr, K.M., Spoerri, A. (2015). Privacy preserving probabilistic record linkage (p3rl): a novel method for linking existing health-related data and maintaining participant confidentiality. BMC Medical Research Methodology, 15(1), 46.
Sergis, S., & Sampson, D.G. (2016). Towards a teaching analytics tool for supporting reflective educational (re) design in inquiry-based stem education. In Advanced Learning Technologies (ICALT), 2016 IEEE 16th International Conference On. https://doi.org/10.1109/icalt.2016.134. IEEE, (pp. 314–318).
Sergis, S., & Sampson, D.G. (2017). Teaching and learning analytics to support teacher inquiry: A systematic literature review, (pp. 25–63): Springer. https://doi.org/10.1007/978-3-319-52977-6_2.
Sergis, S., Sampson, D.G., Rodríguez-Triana, M.J., Gillet, D., Pelliccione, L., de Jong, T. (2017). Using educational data from teaching and learning to inform teachers’ reflective educational design in inquiry-based stem education. Computers in Human Behavior. https://doi.org/10.1016/j.chb.2017.12.014.
Shen, J., Chen, H., Jiang, J. (2018). A research on techniques for data fusion and analysis of cross-platform mooc data. In 2018 17th International Conference on Information Technology Based Higher Education and Training (ITHET). IEEE, (pp. 1–8).
Siemens, G. (2013). Learning analytics: The emergence of a discipline. American Behavioral Scientist, 57(10), 1380–1400.
Stier, S., Breuer, J., Siegers, P., Thorson, K. (2019). Integrating Survey Data and Digital Trace Data: Key Issues in Developing an Emerging Field. https://doi.org/10.1177/0894439319843669.
Subramanya, S. (2014). Toward a more effective and useful end-of-course evaluation scheme. Journal of Research in Innovative Teaching, 7(1).
Suehiro, D., Taniguchi, Y., Shimada, A., Ogata, H. (2017). Face-to-face teaching analytics: Extracting teaching activities from e-book logs via time-series analysis. In Advanced Learning Technologies (ICALT), 2017 IEEE 17th International Conference On. IEEE, (pp. 267–268).
Sun, J., Przybylski, R., Johnson, B.J. (2016). A review of research on teachers’ use of student data: From the perspective of school leadership. Educational Assessment, Evaluation and Accountability, 28(1), 5–33.
Taniguchi, Y., Suehiro, D., Shimada, A., Ogata, H. (2017). Revealing hidden impression topics in students’journals based on nonnegative matrix factorization. In Advanced Learning Technologies (ICALT), 2017 IEEE 17th International Conference On. IEEE, (pp. 298–300).
Thille, C., & Zimmaro, D. (2017). Incorporating learning analytics in the classroom. New Directions for Higher Education, 2017(179), 19–31.
Thomas, C. (2018). Multimodal teaching and learning analytics for classroom and online educational settings. In Proceedings of the 2018 on International Conference on Multimodal Interaction. ACM, (pp. 542–545).
ur Rehman, M.H., Chang, V., Batool, A., Wah, T.Y. (2016). Big data reduction framework for value creation in sustainable enterprises. International Journal of Information Management, 36(6), 917–928.
Van Harmelen, M., & Workman, D. (2012). Analytics for learning and teaching. CETIS Analytics Series, 1(3), 1–40.
van Leeuwen, A., Rummel, N., van Gog, T. (2019). What information should cscl teacher dashboards provide to help teachers interpret cscl situations?International Journal of Computer-Supported Collaborative Learning, 1–29. https://doi.org/10.1007/s11412-019-09299-x.
Vatrapu, R.K. (2012). Towards semiology of teaching analytics. In Workshop Towards Theory and Practice of Teaching Analytics, at the European Conference on Technology Enhanced Learning, TAPTA, vol. 12.
Vatrapu, R.K., Kocherla, K., Pantazos, K. (2013). iklassroom: Real-time, real-place teaching analytics. In IWTA@ LAK.
Vatrapu, R., Reimann, P., Bull, S., Johnson, M. (2013). An eye-tracking study of notational, informational, and emotional aspects of learning analytics representations. In ACM International Conference Proceeding Series. https://doi.org/10.1145/2460296.2460321. https://www.scopus.com/inward/record.uri?eid=2-s2.0-84876499638&doi=10.1145%2f2460296.2460321&partnerID=40&md5=e7b4d83a3e33e7a1c3c5b5f56d5ebe7d, (pp. 125–134).
Vatrapu, R., Reimann, P., Hussain, A., Kocherla, K. (2013). Towards teaching analytics: Repertory grids for formative assessment (rgfa). In CSCL 2013 Conference Proceedings, vol 2, (pp. 422–426).
Vatrapu, R., Tanveer, U., Hussain, A. (2012). Towards teaching analytics: communication and negotiation tool (coneto). In Proceedings of the 7th Nordic Conference on Human-Computer Interaction: Making Sense Through Design. ACM, (pp. 775–776).
Vatrapu, R., Teplovs, C., Fujita, N., Bull, S. (2011). Towards visual analytics for teachers’ dynamic diagnostic pedagogical decision-making. In Proceedings of the 1st International Conference on Learning Analytics and Knowledge. ACM, (pp. 93–98).
Verbert, K., Duval, E., Klerkx, J., Govaerts, S., Santos, J.L. (2013). Learning analytics dashboard applications. American Behavioral Scientist, 57(10), 1500–1509.
Voithofer, R., & Golan, A.M. (2018). 5. Data Sources for Educators, 1st edn.https://doi.org/10.4324/9780203728703-7, (p. 18).
Waller, M.A., & Fawcett, S.E. (2013). Data science, predictive analytics, and big data: a revolution that will transform supply chain design and management. Journal of Business Logistics, 34(2), 77–84.
Wang, F., & Hannafin, M.J. (2005). Design-based research and technology-enhanced learning environments. Educational Technology Research and Development, 53(4), 5–23.
Williamson, B. (2016). Digital education governance: data visualization, predictive analytics, and ’real-time’ policy instruments. Journal of Education Policy, 31(2), 123–141.
Winkler, R., & Söllner, M. (2018). Unleashing the potential of chatbots in education: A state-of-the-art analysis. In Academy of Management Annual Meeting (AOM). https://doi.org/10.5465/ambpp.2018.15903abstract.
Xu, B., & Recker, M. (2012). Teaching analytics: A clustering and triangulation study of digital library user data. Educational Technology & Society, 15(3), 103–115.
Yigitbasioglu, O.M., & Velcu, O. (2012). A review of dashboards in performance management: Implications for design and research. International Journal of Accounting Information Systems, 13(1), 41–59.
Acknowledgements
The research reported is part of an ongoing PhD research study in the area of Big Data Analytics in Higher Education. We also want to thank members of the Technology Enhanced Learning and Teaching (TELT) Committee of the University of Otago, New Zealand for support and for providing constructive feedback.
Funding
This research project was fully sponsored by Higher Education Development Centre, University of Otago, New Zealand.
Author information
Authors and Affiliations
Contributions
IGN conceived and presented the Conceptualisation of Teaching Analytics and Teachingv Outcome Model. BKD developed the Tripartite Approach that was utilised in this research. BKD encouraged IGN to perform a systematic review of teaching analytics that was guided by the Tripartite Approach. BKD supervised the findings of this work. IGN took the lead in writing the manuscript. All authors discussed the results, provided critical feedback and contributed to the final manuscript.
Corresponding author
Ethics declarations
Competing interests
The authors declare that they have no competing interests. All authors have approved the manuscript and agree with its submission to the International Journal of Education Technology in Higher Education. This manuscript has not been published and is not under consideration for publication elsewhere.
Additional information
Publisher’s Note
Springer Nature remains neutral with regard to jurisdictional claims in published maps and institutional affiliations.
Rights and permissions
Open Access This article is licensed under a Creative Commons Attribution 4.0 International License, which permits use, sharing, adaptation, distribution and reproduction in any medium or format, as long as you give appropriate credit to the original author(s) and the source, provide a link to the Creative Commons licence, and indicate if changes were made. The images or other third party material in this article are included in the article’s Creative Commons licence, unless indicated otherwise in a credit line to the material. If material is not included in the article’s Creative Commons licence and your intended use is not permitted by statutory regulation or exceeds the permitted use, you will need to obtain permission directly from the copyright holder. To view a copy of this licence, visit http://creativecommons.org/licenses/by/4.0/.
About this article

Cite this article
Ndukwe, I.G., Daniel, B.K. Teaching analytics, value and tools for teacher data literacy: a systematic and tripartite approach. Int J Educ Technol High Educ 17, 22 (2020). https://doi.org/10.1186/s41239-020-00201-6
Received:
Accepted:
Published:
DOI: https://doi.org/10.1186/s41239-020-00201-6